
Statistics: Histograms and Frequency Tables
Loading the math board and drawing, please wait…
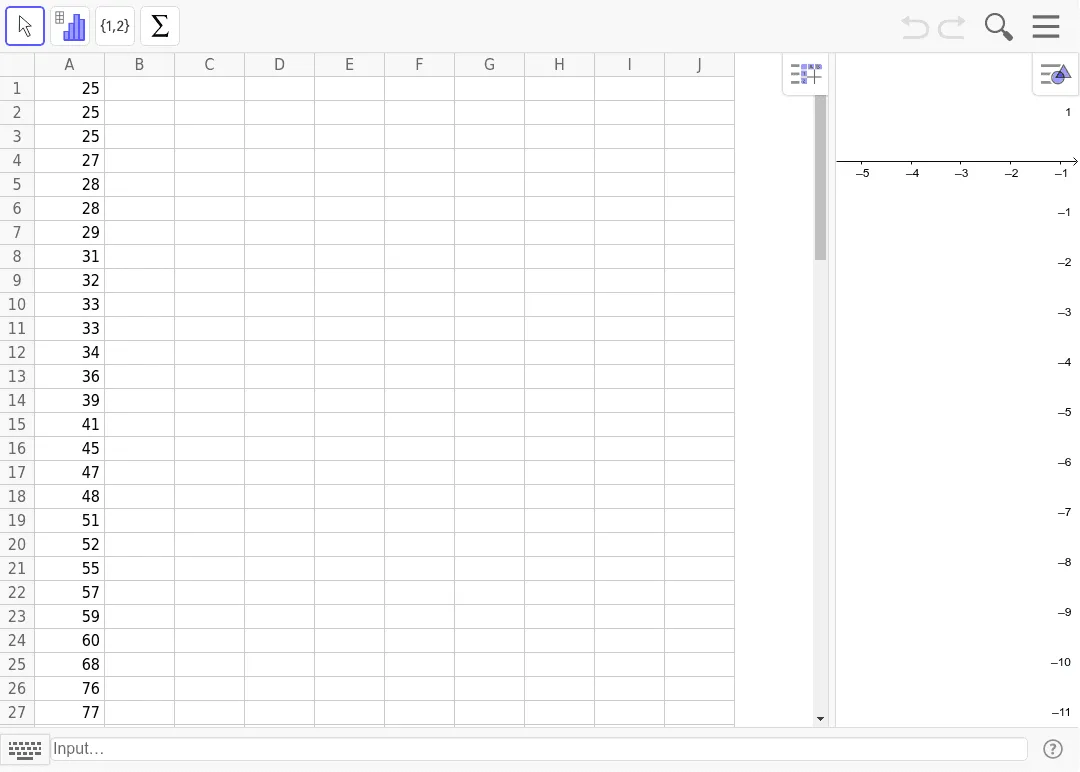
This example demonstrates how to use GeoGebra to create histograms and frequency tables for visualizing data distribution. Key math concepts include statistics, probability, data visualization, bar charts, and function graphs. Construction involves using objects A1 to A30 for data points and chart plotting. Suitable for high school mathematics teaching and introductory data analysis learning.
GeoGebra Commands & Parameters
252525272828293132333334363941454748515255575960687677798080