
Statistics and Probability Calculator with GeoGebra
Loading the math board and drawing, please wait…
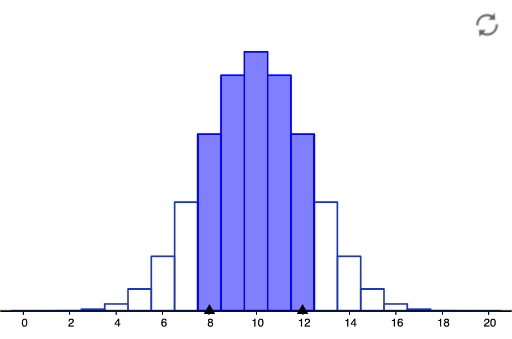
This example demonstrates probability and statistics calculation using GeoGebra. Key mathematical concepts include probability distribution, statistical operations, and geometric construction. The construction involves Sequence, Min, and Max commands to build probability models and visualize results. Suitable for middle school students learning probability basics or teachers for teaching demonstrations.
GeoGebra Commands & Parameters
Sequence(20, 20, 0, 20) →Min(x(Point[xAxis]) + 1.5, x(Point[xAxis]) + 1.5) →Max(x(Point[xAxis]) + 1.5, x(Point[xAxis]) + 1.5) →
AI Drawing Prompt Reference
Draw a probability distribution graph with a sequence from 0 to 20, and an interval defined by minimum and maximum values. The graph should show the distribution of the sequence within the interval. The construction order is to create the sequence first, then determine the minimum and maximum values, and finally draw the graph to visualize the probability model.
The prompt above was compiled from the original drawing commands and is for reference only.