
STAT300 Binomial Distribution Histogram
Loading the math board and drawing, please wait…
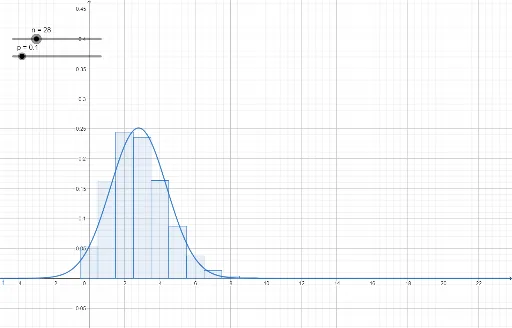
This GeoGebra example visualizes the binomial distribution histogram for a STAT300-level statistics course, illustrating the probability of each possible number of successes in n independent trials with success probability p. Core mathematical concepts include the binomial probability formula, combinatorial counting, the role of the exponent in the distribution, and normal approximation to the binomial. Construction utilizes GeoGebra commands BinomialDist and Normal, with key objects representing parameters n, p, q (failure probability), and interval endpoints a, b, c, along with function f. The example is ideal for undergraduate introductory statistics students seeking to understand discrete probability distributions, their graphical representation, and hypothesis testing applications.
GeoGebra Commands & Parameters
BinomialDist(n, p) → cNormal((n * p), sqrt(((n * p) * q)), x, false) → f