
Standard Normal Distribution by UNSW School of Mathematics and Statistics
Loading the math board and drawing, please wait…
In collections
UNSW MATH1131/1231 Algebra material
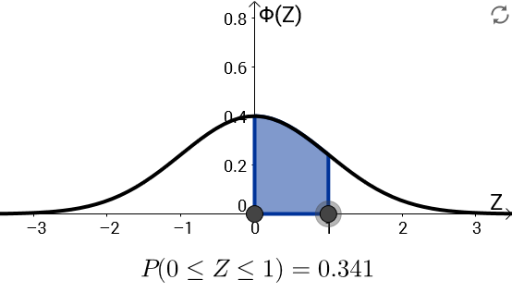
This GeoGebra example demonstrates the standard normal distribution by visualizing the probability area under the curve using interactive input boxes and integral objects. It involves core concepts such as the normal probability density function, cumulative distribution function, and interval probability calculation. Construction uses GeoGebra commands Textfield, Integral, and objects including S, a, M, f, s, t, InputBox1, N, A, InputBox2, P1, P2, and text1. Suitable for high school statistics units, college introductory statistics, or probability courses, it helps learners develop an intuitive understanding of standard normal distribution properties through dynamic visualization.
GeoGebra Commands & Parameters
Textfield(M) → InputBox1Integral(f, Min[s, t], Max[s, t]) → ATextfield(S) → InputBox2