
Standard Deviation and Variance Calculation
Loading the math board and drawing, please wait…
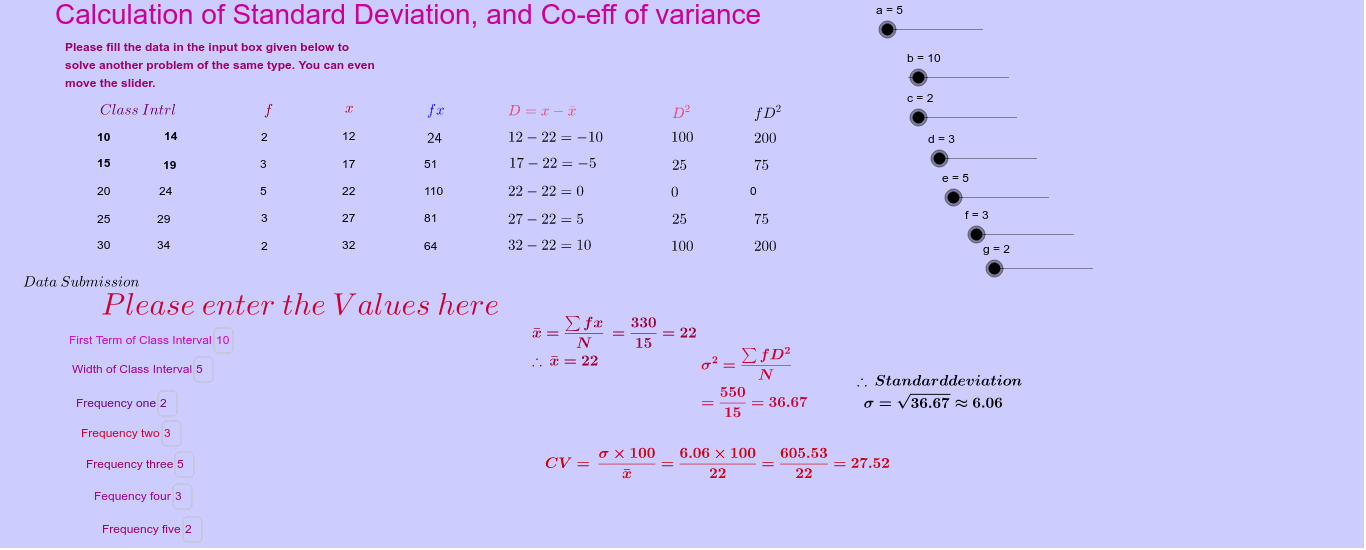
This example demonstrates how to calculate variance and standard deviation for a set of data using GeoGebra. Core math concepts include variance, standard deviation, and coefficient of variation. It utilizes GeoGebra commands and objects like Textfield, a, b, text1, t1, etc. Suitable for high school students and teachers for learning and teaching purposes.
GeoGebra Commands & Parameters
Textfield(b) → inputBox1Textfield(a) → inputBox2Textfield(c) → inputBox3Textfield(d) → inputBox4Textfield(e) → inputBox5Textfield(f) → inputBox6Textfield(g) → inputBox7
AI Drawing Prompt Reference
Draw the variance and standard deviation of a set of data. Use inputBox1 to input7 to enter data points, then calculate and display the variance, standard deviation, and coefficient of variation.
The prompt above was compiled from the original drawing commands and is for reference only.