
Mean, Median, and Mode for Ungrouped Data
Loading the math board and drawing, please wait…
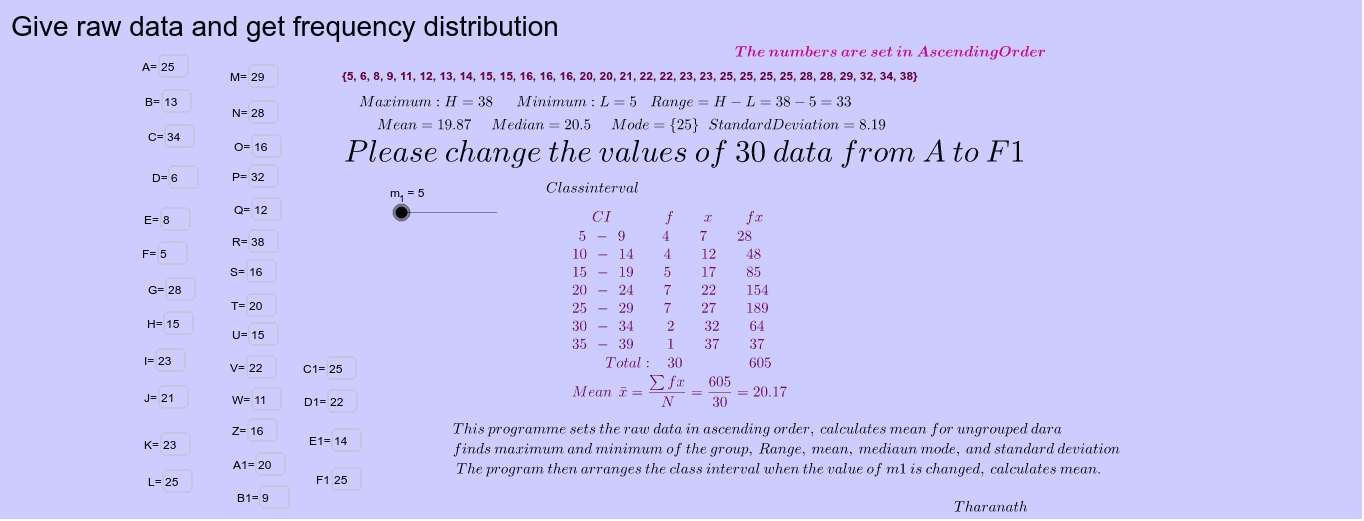
This example demonstrates how to calculate the mean, median, and mode for ungrouped data. Students input values in input boxes A to F. Using GeoGebra commands such as Sort, Max, Min, Median, Mean, and Mode, the process of calculating these statistical measures is clearly shown. Suitable for students at the middle school level and above to learn basic statistics.
GeoGebra Commands & Parameters
Textfield(a) → inputBox1Textfield(b) → inputBox2Textfield(c) → inputBox3Textfield(d) → inputBox4Textfield(e) → inputBox5Textfield(f) → inputBox6Textfield(g) → inputBox7Textfield(h) → inputBox8Textfield(i) → inputBox9Textfield(j) → inputBox10Sort({a, b, c, d, e, f, g, h, i, j}) → list1Textfield(k) → inputBox11Textfield(l) → inputBox12Textfield(m) → inputBox13Textfield(n) → inputBox14Textfield(o) → inputBox15Textfield(p) → inputBox16Textfield(q) → inputBox17Textfield(r) → inputBox18Textfield(s) → inputBox19Textfield(t) → inputBox20Textfield(u) → inputBox21Textfield(v) → inputBox22Textfield(w) → inputBox23Textfield(z) → inputBox24Textfield(a_1) → inputBox25Textfield(b_1) → inputBox26Textfield(c_1) → inputBox27Textfield(d_1) → inputBox28Textfield(e_1) → inputBox29Textfield(f_1) → inputBox30Sort({a, b, c, d, e, f, g, h, i, j, j, k, l, m, n, o, p, q, r, s, t, u, v, w, z, a_1, b_1, c_1, d_1, e_1, f_1}) → list2Sort({a, b, c, d, e, f, g, h, i, j, k, l, m, n, o, p, q, r, s, t, u, v, w, z, a_1, b_1, c_1, d_1, e_1, f_1}) → list3Max(list3) → g_1Min(list3) → h_1Median(list3) → i_1Mean(list3) → j_1Mode(list3) → list4SD(list3) → k_1Variance(list3) → l_1OrdinalRank(list3) → list5CountIf(x ≤ r1, list3) → n_1
AI Drawing Prompt Reference
Draw the mean, median, and mode for a set of ungrouped data. First, input 10 data points, then sort them to find the maximum, minimum, median, and mean, and finally determine the mode.
The prompt above was compiled from the original drawing commands and is for reference only.