
St Louis Gateway Arch Construction
Loading the math board and drawing, please wait…
In collections
Calculus 1 Graphical Illustrations
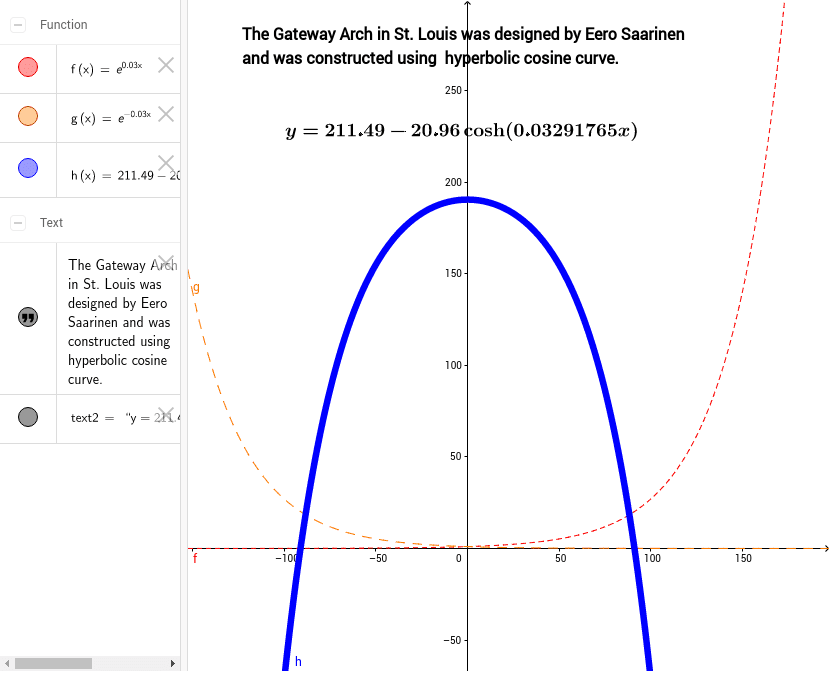
This example demonstrates how to construct the 3D model of the St Louis Gateway Arch and related function graphs using GeoGebra. Key math concepts include piecewise functions, linear regression, volume calculation, and inequalities. Construction highlights involve objects f, g, h for defining functions/geometries and text1, text2 for annotations. Suitable for high school and above students learning spatial geometry, function graphs, and data analysis, ideal for classroom demonstrations or mathematical modeling projects.
GeoGebra Commands & Parameters
f(x) = exp((0.03291765 * x))g(x) = exp(((-0.03291765) * x))h(x) = 211.49 - (20.96 * (f(x) + g(x)) / 2)