
Solving Quadratic Equations & Inequalities
Loading the math board and drawing, please wait…
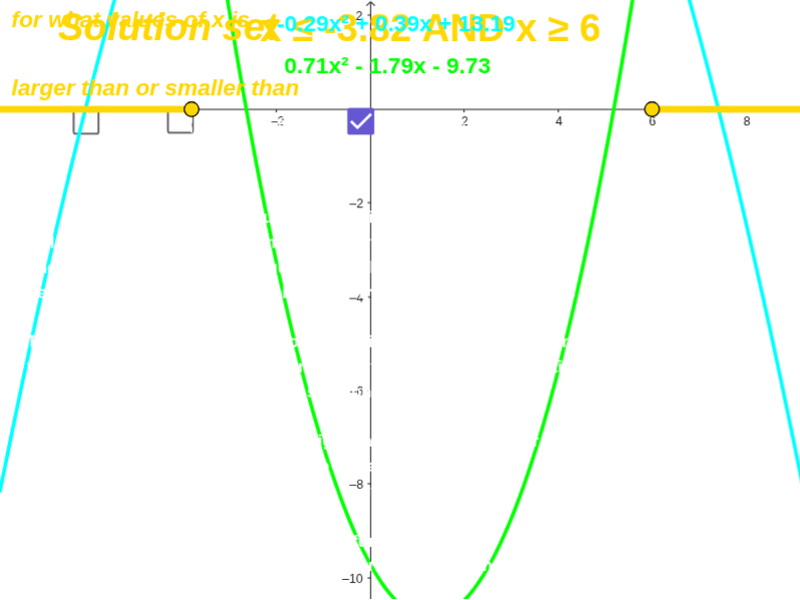
This example demonstrates how to use GeoGebra to graph quadratic equations and inequalities, showing solution sets and key features like parabolas, vertex, axis of symmetry, and inequality regions. It involves core math concepts such as quadratic functions and their geometric interpretations. Construction highlights include using commands like Point, Polynomial, Segment, Ray, and objects like G, I, A, C, i, K, B, D, j, L, scale, UpDown, F, f, b, c, d, e, g, h, text elements, and more. Suitable for high school mathematics education to visually aid students in understanding quadratic solutions and geometric meanings.
GeoGebra Commands & Parameters
Point(xAxis) → APoint(i) → KPoint(xAxis) → BPoint(j) → LPolynomial({C, D, F}) → fSegment(A, B) → eRay(B, (x(B) + 1, 0)) → gRay(A, (x(A) - 1, 0)) → hPolynomial({K, G, L}) → rPolynomial({K, I, L}) → qPolynomial({C, D, E}) → p
AI Drawing Prompt Reference
Draw a graph showing quadratic functions, their vertices, axes of symmetry, and inequality solution sets. Start by plotting two points on the x-axis and construct two rays through these points. Then, create two quadratic function graphs using four points and another two graphs using three points. Finally, highlight the solution regions for the inequalities using these function graphs.
The prompt above was compiled from the original drawing commands and is for reference only.