
Solving Absolute Value Inequalities with Less Than
Loading the math board and drawing, please wait…
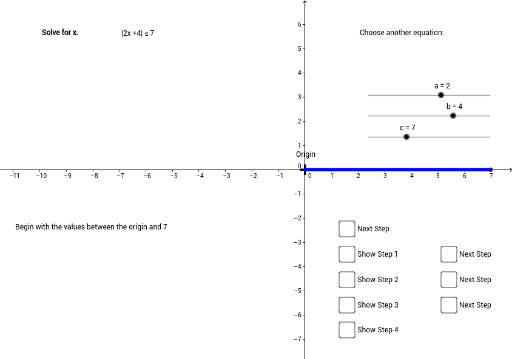
This example demonstrates how to graph the solution set of an absolute value inequality using GeoGebra, focusing on the geometric interpretation of linear functions and regions. Key GeoGebra commands like Segment are used to construct lines, points, and annotations (e.g., H, c, B, a, b, A, d, e, f, G, F, g, C, h, D, E, j, i). It is suitable for high school students learning the geometric meaning of absolute value inequalities and for classroom demonstrations.
GeoGebra Commands & Parameters
Segment(F, G) → gSegment(B, H) → hSegment(D, E) → jSegment(H, C) → i