
Sphere Volume Demonstration by Kerry Gallagher
Loading the math board and drawing, please wait…
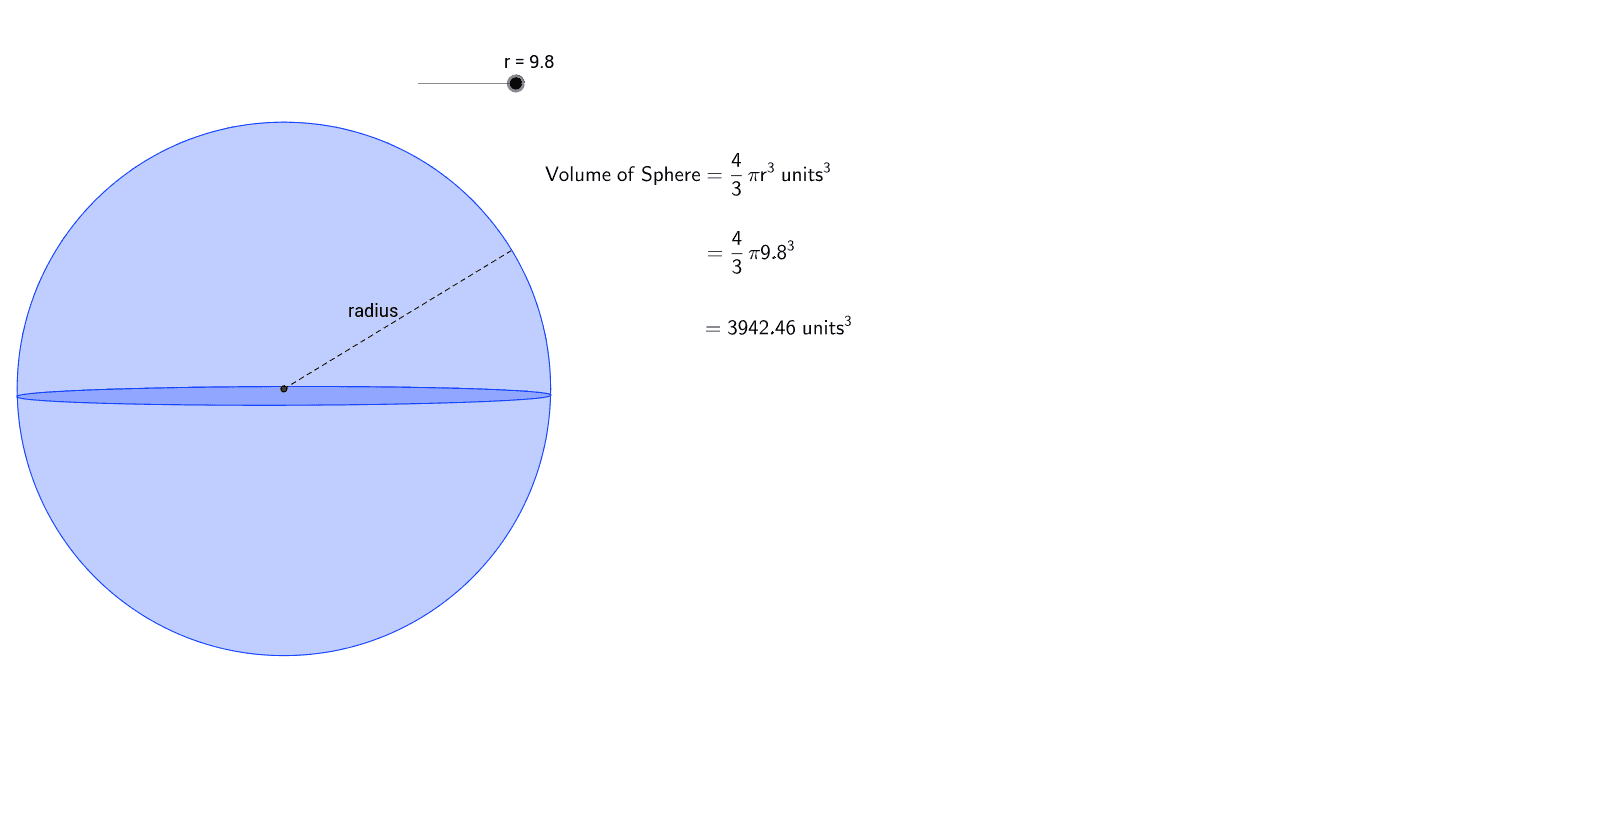
This example visually demonstrates how the volume of a sphere changes as its radius is adjusted. It involves core math concepts like the sphere volume formula, spatial geometry, and variable relationships. Constructed using GeoGebra commands/objects such as Segment, Circle, Intersect, Point, and Ellipse. Suitable for high school solid geometry teaching or mathematical exploration to understand the functional relationship between volume and radius.
GeoGebra Commands & Parameters
Segment(B, A) → hCircle(B, D) → eCircle(A, Radius[e]) → fIntersect(e, f, 1) → EIntersect(e, f, 2) → FSegment(E, F) → bIntersect(h, b) → GCircle(G, r) → gPoint(g) → KPoint(g) → HemisphereEllipse(K, Hemisphere, M) → kPoint(g) → NSegment(G, N) → radius
AI Drawing Prompt Reference
Draw a sphere to demonstrate how its volume changes with the radius. Start by drawing a line segment, then create two circles: one centered at one endpoint of the segment and the other with the radius equal to the first circle's radius. Find the intersection points of these circles, draw a line through them, and intersect it with the original segment. Use this intersection point as the center to draw the sphere, highlighting the center, radius, and a semicircular ellipse representing the hemisphere.
The prompt above was compiled from the original drawing commands and is for reference only.