
Sphere and Cone Section Demonstration
Loading the math board and drawing, please wait…
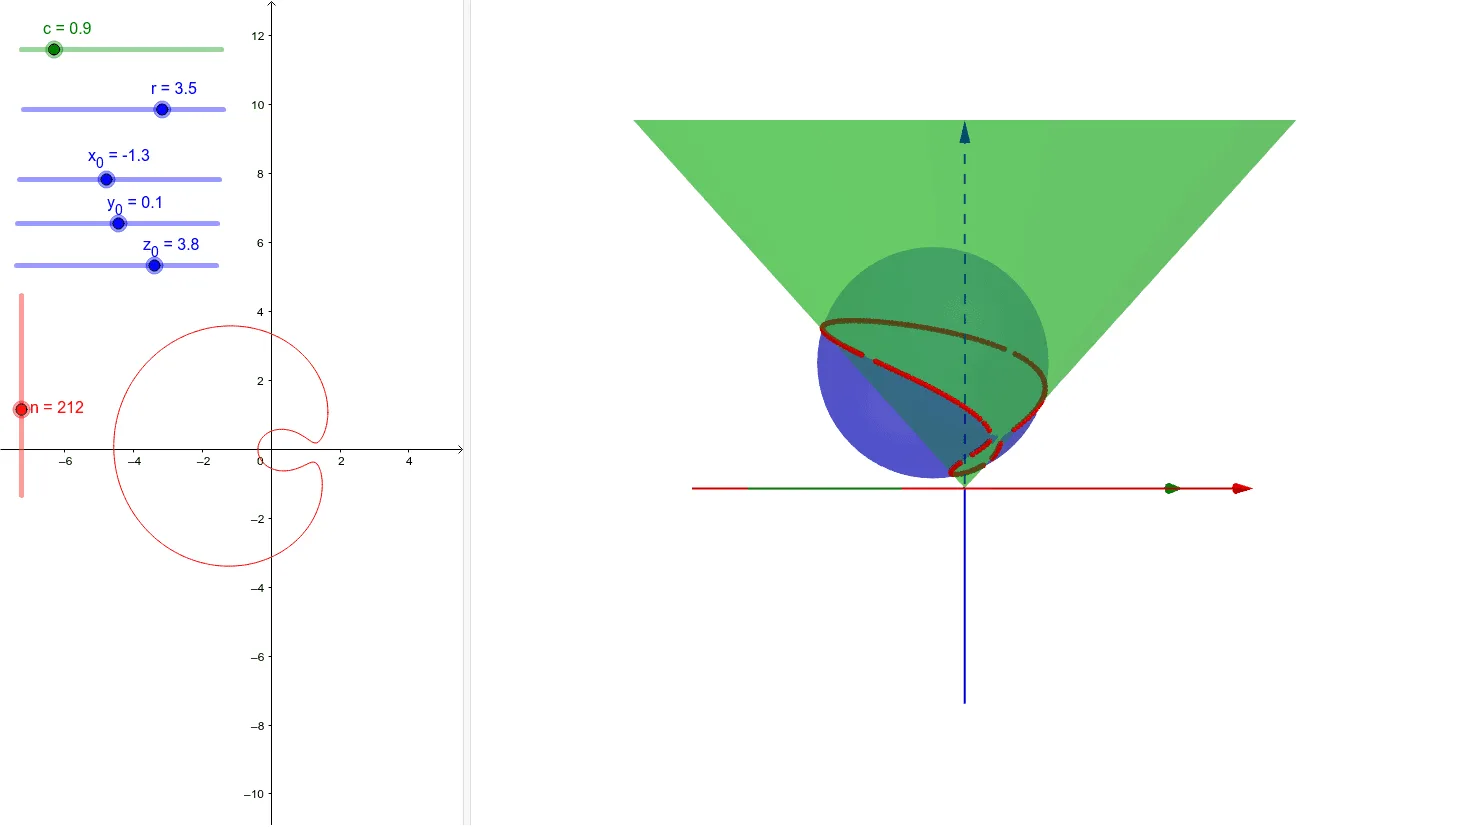
This example demonstrates the cross-sections formed by a sphere and a cone, showing how they change interactively. Key math concepts include spheres, cones, quadratic curves, linear programming, and functions. The construction uses GeoGebra commands like Sequence for generating sequences, Sphere for creating spheres, and RemoveUndefined for cleaning undefined objects, with sliders to dynamically visualize the cross-section shapes. Suitable for high school students and math enthusiasts studying spatial geometry and properties of quadratic surfaces.
GeoGebra Commands & Parameters
Sequence(Point[e, i], i, 0, 1, 1 / n) → liste1Sphere((x_0, y_0, z_0), r) → aRemoveUndefined(Sequence[If[(x(Element[liste1, i])^(2) * (1 + 1 / c^(2))) - ((2 * x_0) * x(Element[liste1, i])) + (y(Element[liste1, i])^(2) * (1 + 1 / c^(2))) - ((2 * y_0) * y(Element[liste1, i])) + x_0^(2) + y_0^(2) + z_0^(2) - r^(2) ≟ ((2 * z_0 / c) * sqrt(x(Element[liste1, i])^(2) + y(Element[liste1, i])^(2))), Element[liste1, i]], i, 1, n]) → liste3Sequence((x(Element[liste3, i]), y(Element[liste3, i]), g(x(Element[liste3, i]), y(Element[liste3, i]))), i, 1, Length[liste3]) → liste30
AI Drawing Prompt Reference
Draw a sphere centered at the origin with a radius of 5 and a cone with a base radius of 3 and height of 4. Adjust the cone's angle and position to observe the different cross-sections formed, including ellipses, parabolas, and hyperbolas. Use sliders to dynamically show the changes in the cross-sections.
The prompt above was compiled from the original drawing commands and is for reference only.