
Spain: Third Degree Inequalities
Loading the math board and drawing, please wait…
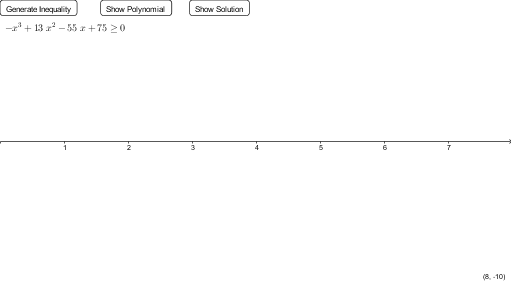
This example demonstrates the graph of third degree inequalities and its solution set region in the Cartesian coordinate system. Core mathematical concepts include inequalities, tangent function, division, centroid of triangles, triangles, upper and lower sum or Riemann sum. Construction highlights the use of GeoGebra commands Random and RandomElement, along with objects like button1, b, c, e, a, f, d, text1, textPosition, button2_1, k, button2_2, m, A, B, C for generating and manipulating graphical elements. Suitable for high school and above mathematics learners to understand inequality graphs and properties.
GeoGebra Commands & Parameters
Random(-5, 5) → bRandom(-5, 5) → cRandomElement({-1, 1}) → eRandom(-5, 5) → a
AI Drawing Prompt Reference
Draw a Cartesian coordinate system with a third-degree polynomial curve. Randomly generate three coefficients for the cubic, quadratic, and linear terms, and randomly choose the sign of the leading term. Plot the curve and shade the region where the polynomial is greater than or less than zero to show the solution set. Include a triangle whose vertices are at intersections of the curve with axes or at random points, and mark its centroid. Add a button that, when clicked, regenerates the coefficients and updates the curve, shaded region, triangle, and centroid. The graph should clearly display the curve, shaded area, triangle, and centroid.
The prompt above was compiled from the original drawing commands and is for reference only.