
Space Race Data
Loading the math board and drawing, please wait…
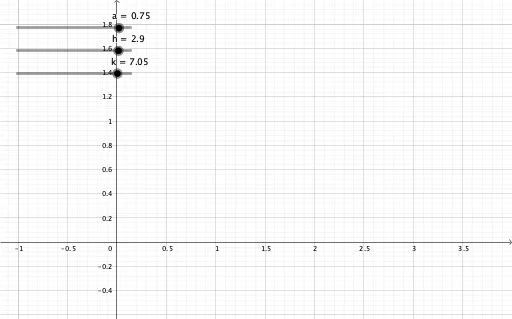
This is an example of quadratic modeling. By adjusting parameters a, h, k, c, you can observe changes in the quadratic function graph. L_1 is a line, a, h, k, c are the coefficients of the quadratic function, and c represents the y-intercept of the line. Suitable for high school math education.
GeoGebra Commands & Parameters
{}Numeric a(0.75)Numeric h(2.9)Numeric k(7.05)y = (a * (x - h)^(2)) + k
AI Drawing Prompt Reference
Draw a quadratic function graph with a vertex at (2.9, 7.05), opening upward, with a shape factor of 0.75. The curve is a smooth parabola symmetric about a vertical line. Also include a straight line whose y-intercept is adjustable via a parameter, though its current value is not specified. All parameters are controlled by sliders to explore changes in the parabola's position and shape. The graph is set on a coordinate plane with x- and y-axes, suitable for high school math modeling demonstrations.
The prompt above was compiled from the original drawing commands and is for reference only.