
Solving Quadratic Equations & Inequalities by Judah L Schwartz
Loading the math board and drawing, please wait…
In collections
Equations & Inequalities as Comparisons of Functions
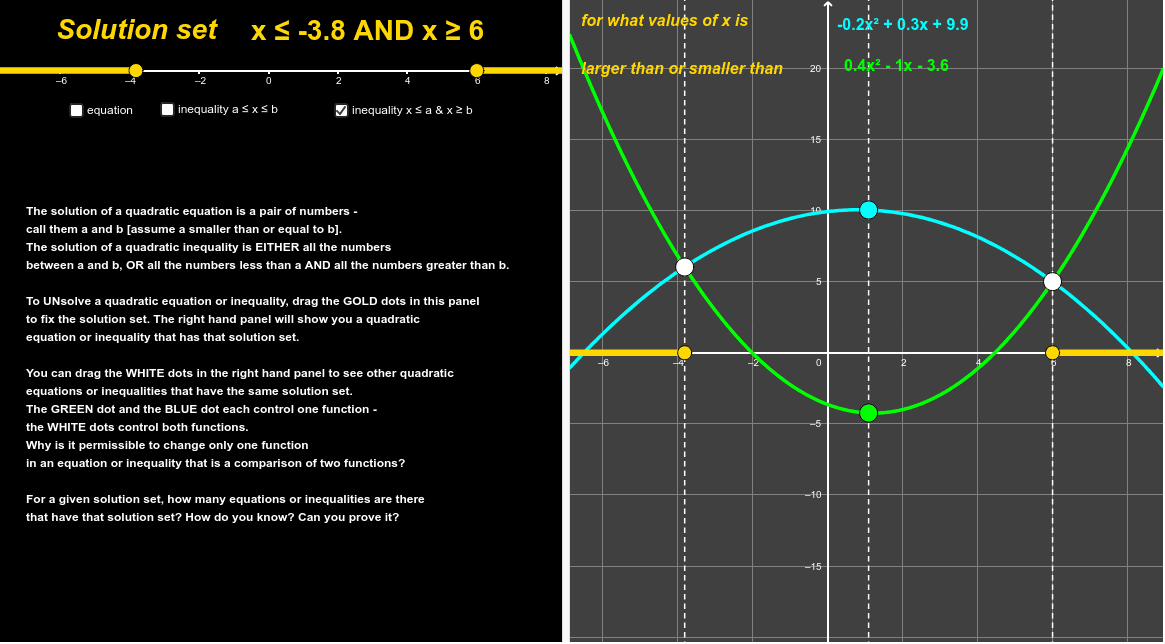
This example demonstrates the graphical solution and visualization of quadratic equations and inequalities. It involves core math concepts like quadratic function graphs, vertex, axis of symmetry, discriminant, solution intervals, etc. Constructed using commands such as Point, Polynomial, Segment, Ray, and objects like scale, A, C, i, K, B, a, H, D, j, L, J, UpDown, J', F, H', f, b, c, d, e, g, h, text6, text7, text8, text10, text15, text16, r, E, p, q, text1_1, text18, text13, text17_1, text3, text1. Suitable for high school mathematics teaching, helping students visually understand the methods and properties of quadratic equations and inequalities, enhancing their ability to combine numbers and shapes.
GeoGebra Commands & Parameters
Point(xAxis) → APoint(i) → KPoint(xAxis) → BPoint(a) → HPoint(j) → LPoint(a) → JPolynomial({C, D, F}) → fSegment(A, B) → eRay(B, (x(B) + 1, 0)) → gRay(A, (x(A) - 1, 0)) → hPolynomial({K, H, L}) → rPolynomial({C, D, E}) → pPolynomial({K, J, L}) → q
AI Drawing Prompt Reference
Create a coordinate plane and draw two quadratic curves: one opening upward and one opening downward. Indicate the vertices and axes of symmetry for each parabola, and shade the region between them to represent the solution set of the inequality. Mark the x‑intercepts of both curves, connect two points on the x‑axis with a line segment, and extend a ray to the left from the left point and a ray to the right from the right point. Include additional points that define the other parabolas, and label the curves to show their relationships.
The prompt above was compiled from the original drawing commands and is for reference only.