
Solving Function Inequalities with Graphs
Loading the math board and drawing, please wait…
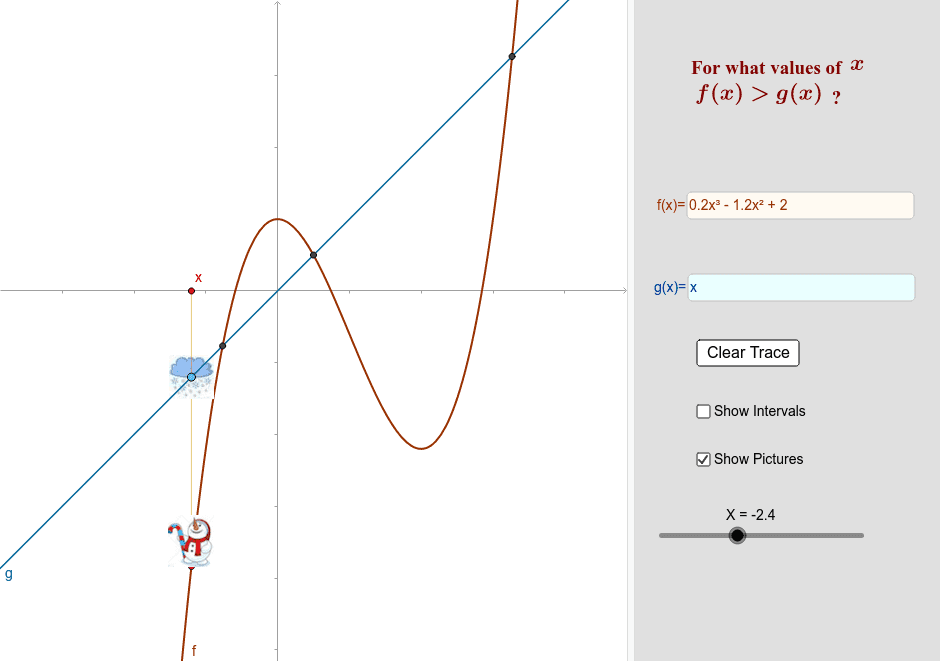
This example demonstrates how to solve function inequalities using graphical methods. Key math concepts include function graphs, solution sets of inequalities, and the connection between algebra and geometry. GeoGebra commands and objects used in construction are If, Midpoint, Distance, Line, Circle, Intersect, Textfield, and Segment. Suitable for high school mathematics teaching or self-learning to understand the visual approach to solving function inequalities.
GeoGebra Commands & Parameters
If(y(A) > y(O), 1, 0) → aIf(a < 1, 1, 0) → bMidpoint(G, H) → KDistance(G, H) → dLine(A, xAxis) → eCircle(A, dd) → cIntersect(c, e) → L, NTextfield(f) → InputBox1Textfield(g) → InputBox2Intersect(f, g, x(Corner[1]), x(Corner[2])) → C, D, E, QSegment(A, O) → c_1Segment(C, C1) → iSegment(D, D1) → jSegment(E, E1) → kDistance(F, P) → d1Segment(O, B) → lSegment(Q, Q1) → p