
Solving Absolute Value Inequalities (Greater Than or Equal To)
Loading the math board and drawing, please wait…
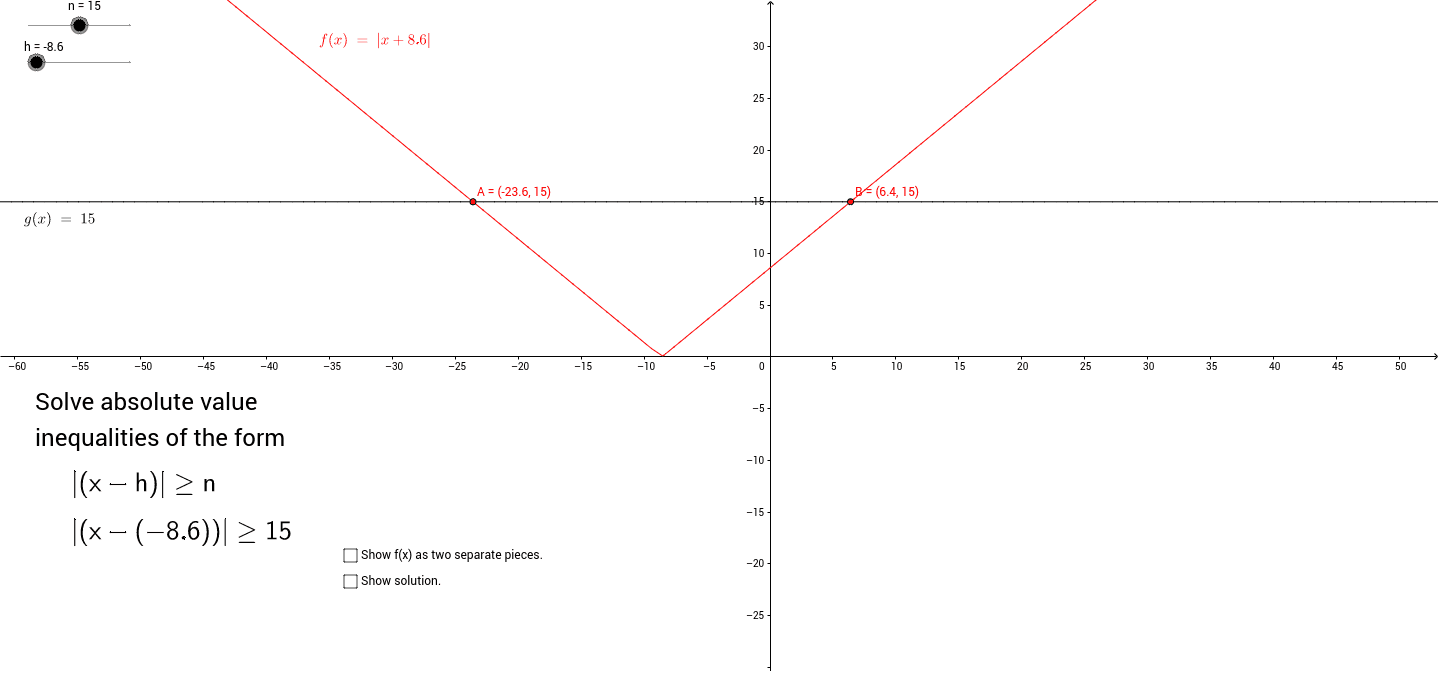
This example guides students in exploring and solving absolute value inequalities (greater than or equal to). Key mathematical concepts include absolute value and inequalities. Using GeoGebra commands such as Function and Intersect, students can visually analyze the solution set of the inequalities. Suitable for middle school and above students for learning and teaching purposes.
GeoGebra Commands & Parameters
Function(-(x - h), -1000, h) → f1Function(x - h, h, 1000) → f2LaTeX(f1, true, true) → text1LaTeX(f2, true, true) → text2Intersect(g, f, (-23.6, 15)) → AIntersect(g, f, (6.3999999999999995, 15)) → BFunction(f1, -1000, S1) → i1Function(f2, S2, 1000) → i2
AI Drawing Prompt Reference
Draw a graph of an absolute value inequality (greater than or equal to), including two line segments f1 and f2 representing the absolute value function at x-h and x-h. Then, draw the intersection points A and B of these two line segments above the x-axis. Finally, draw the extensions i1 and i2 of these two line segments below the x-axis.
The prompt above was compiled from the original drawing commands and is for reference only.