
Solve and Graph Inequalities
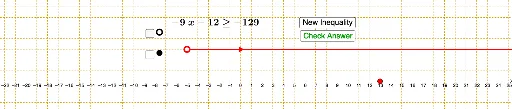
Loading the math board and drawing, please wait…
This example demonstrates how to solve inequalities and graph their solution sets on a coordinate plane. Key math concepts include inequality solving, number line representation, and region plotting. GeoGebra commands and objects used in the construction are RandomElement, Random, Simplify, If, Ray, and elements like a, b, ans, right, left. It is suitable for high school mathematics teaching, helping students understand the geometric meaning and solution methods of inequalities.
GeoGebra Commands & Parameters
RandomElement({-10, -11, -9, -8, -7, -6, -5, -4, -3, -2, -1, 1, 2, 3, 4, 5, 6, 7, 8, 9, 10}) → aRandom(-20, 20) → bRandomElement({-20, -19, -18, -17, -16, -15, -14, -13, -12, -11, -10, -9, -8, -7, -6, -5, -4, -3, -2, -1, 1, 2, 3, 4, 5, 6, 7, 8, 9, 10, 11, 12, 13, 14, 15, 16, 17, 18, 19, 20}) → ansSimplify((a * x) + b) → leftRandomElement({-2, -1, 1, 2}) → snIf(sn ≟ -2, left(x) < right, If[sn ≟ -1, left(x) ≤ right, If[sn ≟ 1, left(x) ≥ right, left(x) > right]]) → cRay(D, E) → kIf(D ≟ B ∧ e ≟ k ∧ (sn ≟ -2 ∧ f ∨ sn ≟ 2 ∧ f) ∨ sn ≟ -1 ∧ g ∨ sn ≟ 1 ∧ g, "Correct!", "Try Again!") → text4RandomElement({-4, -3, -2, -1, 1, 2, 3, 4, 5}) → l