
Number Line Inequalities
Loading the math board and drawing, please wait…
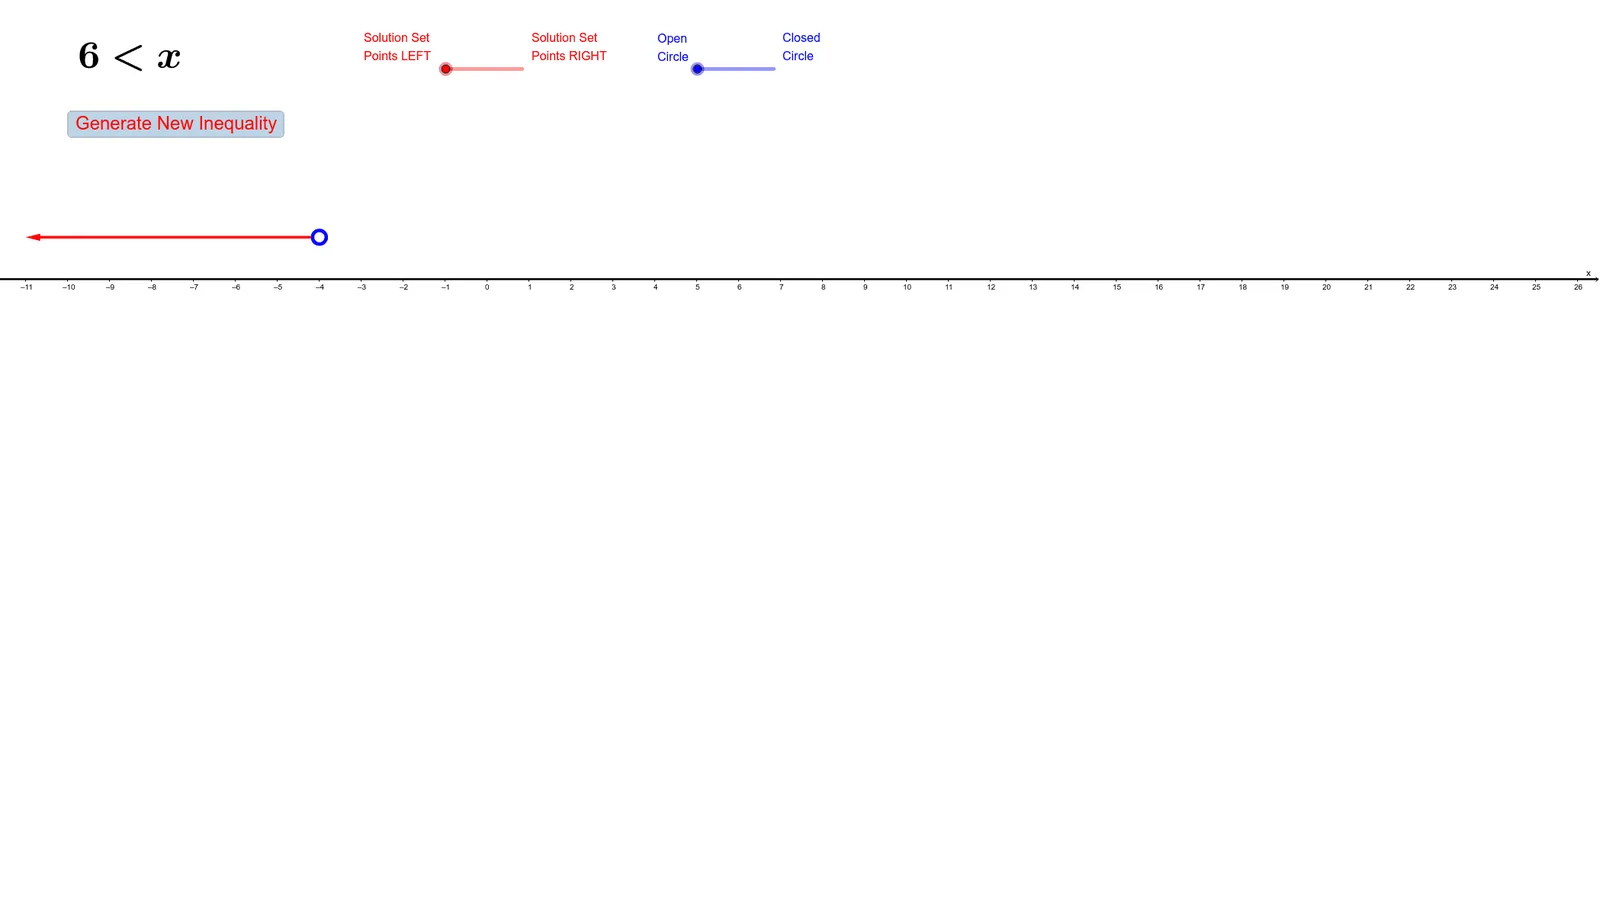
This example demonstrates the graphical representation of inequality solutions on a number line. Core math concepts include inequalities, number line notation, and intervals. It is constructed using GeoGebra commands/objects like Random (random numbers), Point (points), DynamicCoordinates (dynamic coordinates), and Vector (vectors). Suitable for high school mathematics learning, helping students understand the geometric representation and dynamic changes of inequality solutions.
GeoGebra Commands & Parameters
Random(-10, 10) → aPoint(b) → ARandom(1, 4) → eRandom(0, 1) → rDynamicCoordinates(A, round(x(A)), 1) → BVector((x(B) + 0.15, 1), (11, 1)) → uVector((x(B) - 0.15, 1), (-11, 1)) → v
AI Drawing Prompt Reference
Draw a number line with a random point A and a dynamic point B. There are also two vectors u and v pointing right and left. The number line range is from -10 to 10. Points A and B are determined by random numbers. Vectors u and v have a fixed length of 11 and horizontal direction. The overall graphic shows the geometric representation of inequality solutions, helping to understand intervals and dynamic changes on the number line.
The prompt above was compiled from the original drawing commands and is for reference only.