
Slope of Sine Function by Allen Olson
Loading the math board and drawing, please wait…
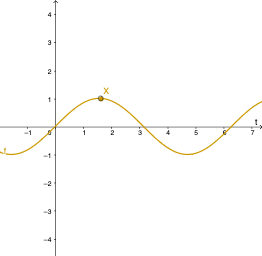
This example dynamically demonstrates the relationship between the sine function and its slope, helping students understand the geometric meaning of trigonometric functions. By drawing the sine function graph and its tangent lines, students can observe the slope changes of the sine function at different points. GeoGebra commands used include Point, Tangent, objects f, X, a, V, g, h, b, A. Suitable for high school mathematics education and learning.
GeoGebra Commands & Parameters
Point(f) → XTangent(X, f) → aTangent(V, g) → b
AI Drawing Prompt Reference
Draw the graph of a sine function and mark several points on it. Then, draw tangent lines from these points to the sine curve, showing how the slope of the tangent lines changes, which helps understand the relationship between the derivative of the sine function and the slope of the tangent lines. First, plot the sine function curve, then select some points on the curve, draw tangent lines for each point, and finally observe how the slope of the tangent lines varies with the points.
The prompt above was compiled from the original drawing commands and is for reference only.