
Slope-Intercept Linear Equation Graph
Loading the math board and drawing, please wait…
In collections
Graphing Linear Equations
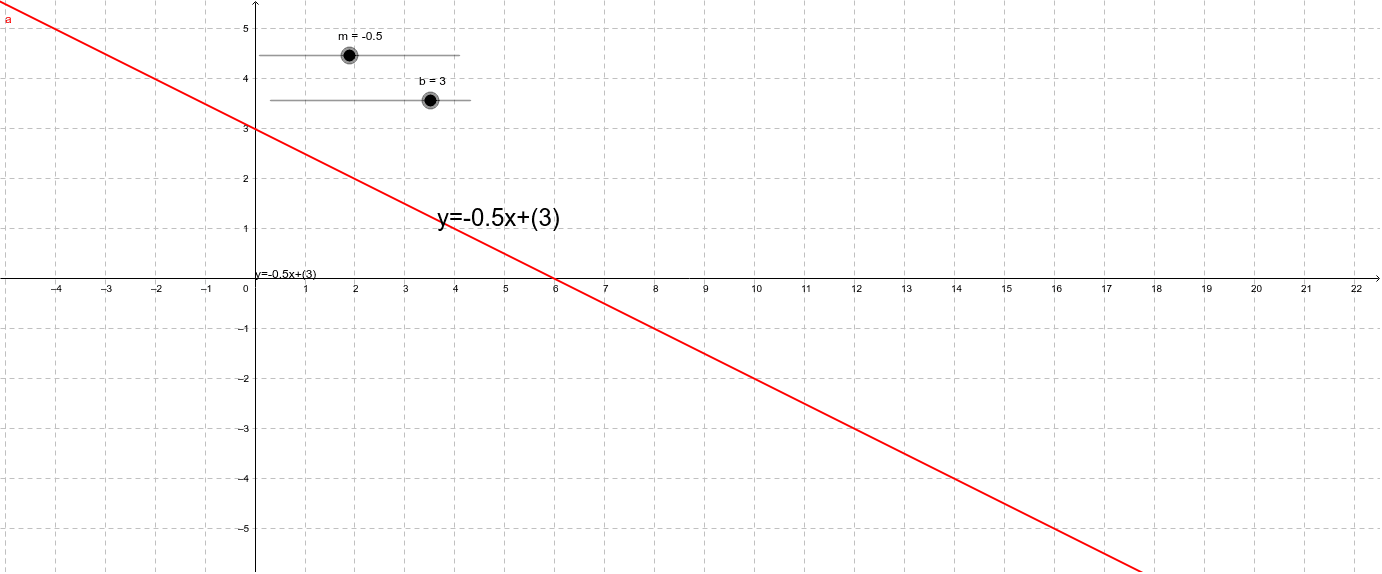
This example demonstrates the graphing of linear equations in slope-intercept form y=mx+b, illustrating how changes in slope (m) and y-intercept (b) affect the line's position. Core mathematical concepts include linear functions, slope, y-intercept, and straight-line equations. The construction uses GeoGebra commands/objects like sliders m and b for parameters, text1 to display the equation dynamically, and the expression 'y=' + m + 'x+' + b to show the current equation. It is suitable for middle school students and above to explore linear function properties and for teaching purposes.
GeoGebra Commands & Parameters
Numeric m(-0.5)Numeric b(3.0)y = m x + b
AI Drawing Prompt Reference
Create a graph demonstrating the slope-intercept form of linear equations y=mx+b, featuring two sliders to control the slope m and y-intercept b, with a dynamic display of the current equation y=mx+b and its corresponding line to observe how changes in m and b affect the line's position.
The prompt above was compiled from the original drawing commands and is for reference only.