
Slope-Intercept Form Demo by Austin Soper
Loading the math board and drawing, please wait…
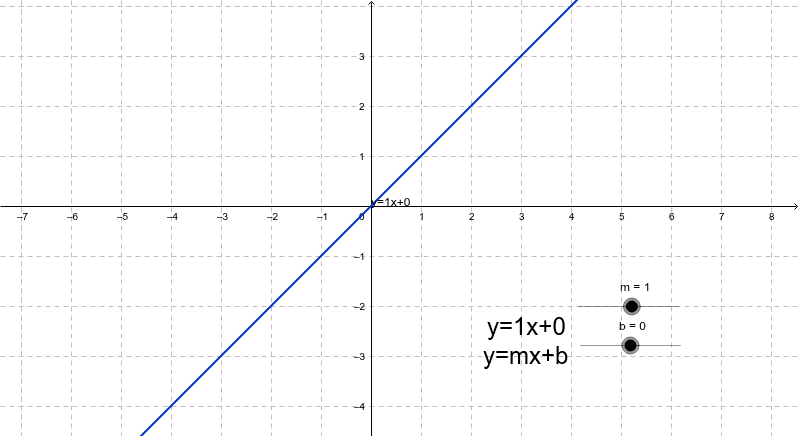
This example demonstrates how the graph of a linear equation in slope-intercept form y=mx+b changes as the slope m and y-intercept b are adjusted using sliders. Key math concepts include linear equations, slope, y-intercept, and function graphing. It is constructed using GeoGebra commands like m, b, text1_1, and dynamic text "y=" + m + "x+" + b. Suitable for middle school and above students learning about linear functions and their properties.
GeoGebra Commands & Parameters
Numeric m(1.0)Numeric b(0.0)y = m x + b