
Slippery Slopes: Deriving the Derivative
Loading the math board and drawing, please wait…
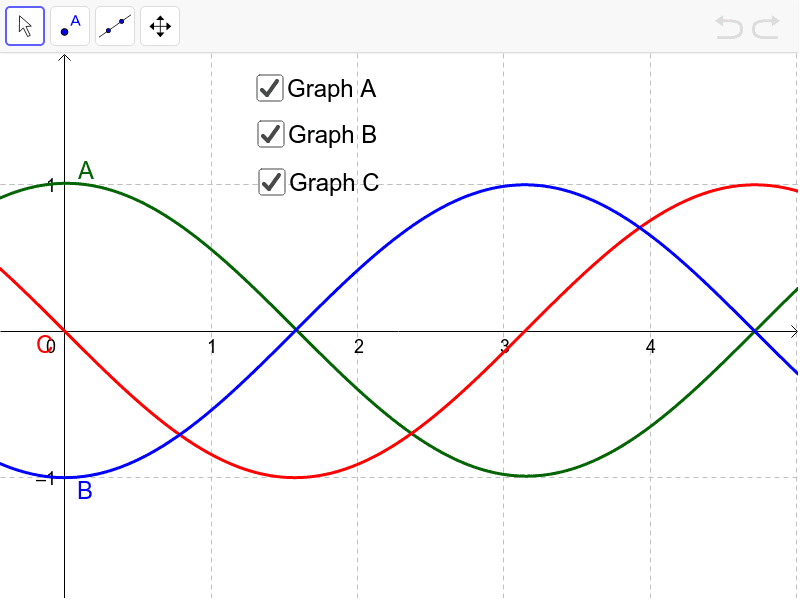
This interactive example demonstrates the geometric relationship between an initial function and its derivative. By exploring the changing slopes of tangent lines, users can visually derive the graph of the derivative function. The construction utilizes GeoGebra points (A, B, C) and associated parameters (a, b, c) to create a dynamic visualization of the slope's evolution. It is designed for high school or early college students studying calculus to intuitively grasp the concept of the derivative as the instantaneous rate of change.
GeoGebra Commands & Parameters
A(x) = cos(x - 0.01024511863893987) + 0.01024511664634109C(x) = (-sin(x))B(x) = (-cos(x))Boolean a(true)Boolean b(true)Boolean c(true)