
Sketching Second Derivative
Loading the math board and drawing, please wait…
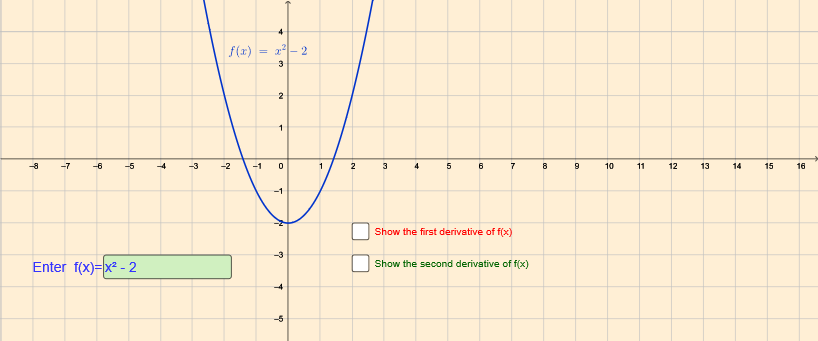
This example demonstrates how to use GeoGebra to graph the second derivative of a function. Key mathematical concepts include derivatives and function graphs. By utilizing commands like TextField, Derivative, and InputBox, users can dynamically observe the changes in the function and its first and second derivatives.
GeoGebra Commands & Parameters
Textfield(f) → InputBox1Derivative(f) → f'Derivative(f') → f''
AI Drawing Prompt Reference
Draw the graph of a function along with its first and second derivatives. Start by inputting a function expression, then display the graph of the function, followed by the graph of the first derivative, and finally the graph of the second derivative, all in the same coordinate system to observe the relationships between the function and its derivatives.
The prompt above was compiled from the original drawing commands and is for reference only.