
SIRD Model Plotting
Loading the math board and drawing, please wait…
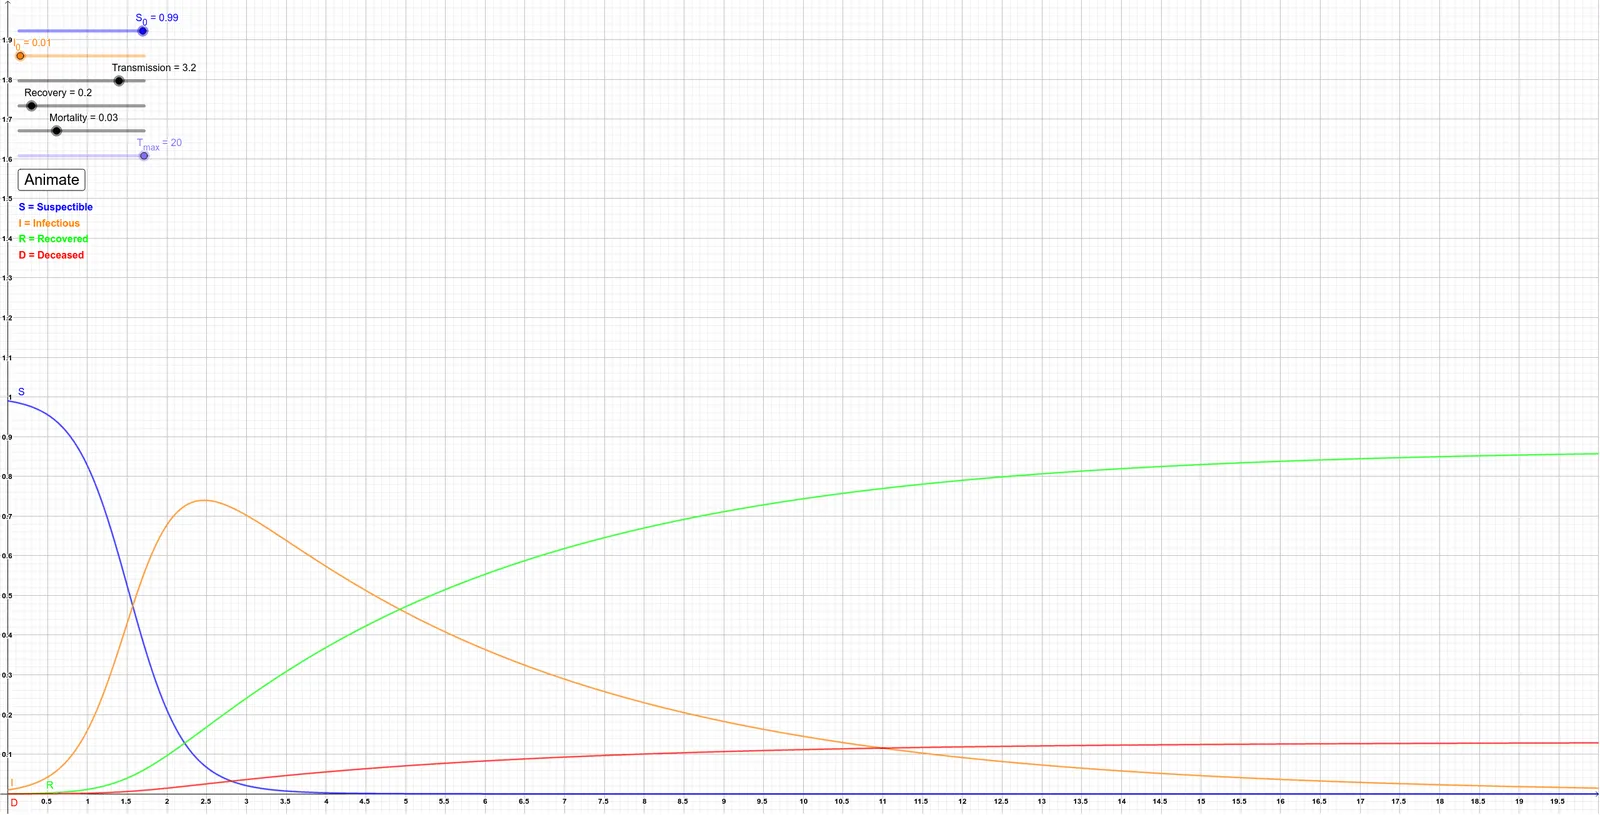
This example demonstrates the plotting of the SIRD model's transmission curve. Key math concepts include differential equations, exponential functions, and probability & statistics. Construction highlights involve using the NSolveODE command to solve differential equations, with objects like S_{0}, I_{0}, Transmission, Recovery, Mortality, T_{max}, S', I', R', D', S, I, R, D, button3, text1, text2, text3, text4. Suitable for high school students and above or related educational purposes.
GeoGebra Commands & Parameters
NSolveODE({S', I', R', D'}, 0, {S_{0}, I_{0}, 0, 0}, T_{max}) → S, I, R, D
AI Drawing Prompt Reference
Plot the SIRD model's transmission curve, including initial infected population I_{0}, maximum time T_{max}, transmission rate Transmission, recovery rate Recovery, and mortality rate Mortality. Use the NSolveODE command to solve the differential equations S', I', R', and D', and obtain the change curves of S, I, R, and D.
The prompt above was compiled from the original drawing commands and is for reference only.