
Sine Wave
Loading the math board and drawing, please wait…
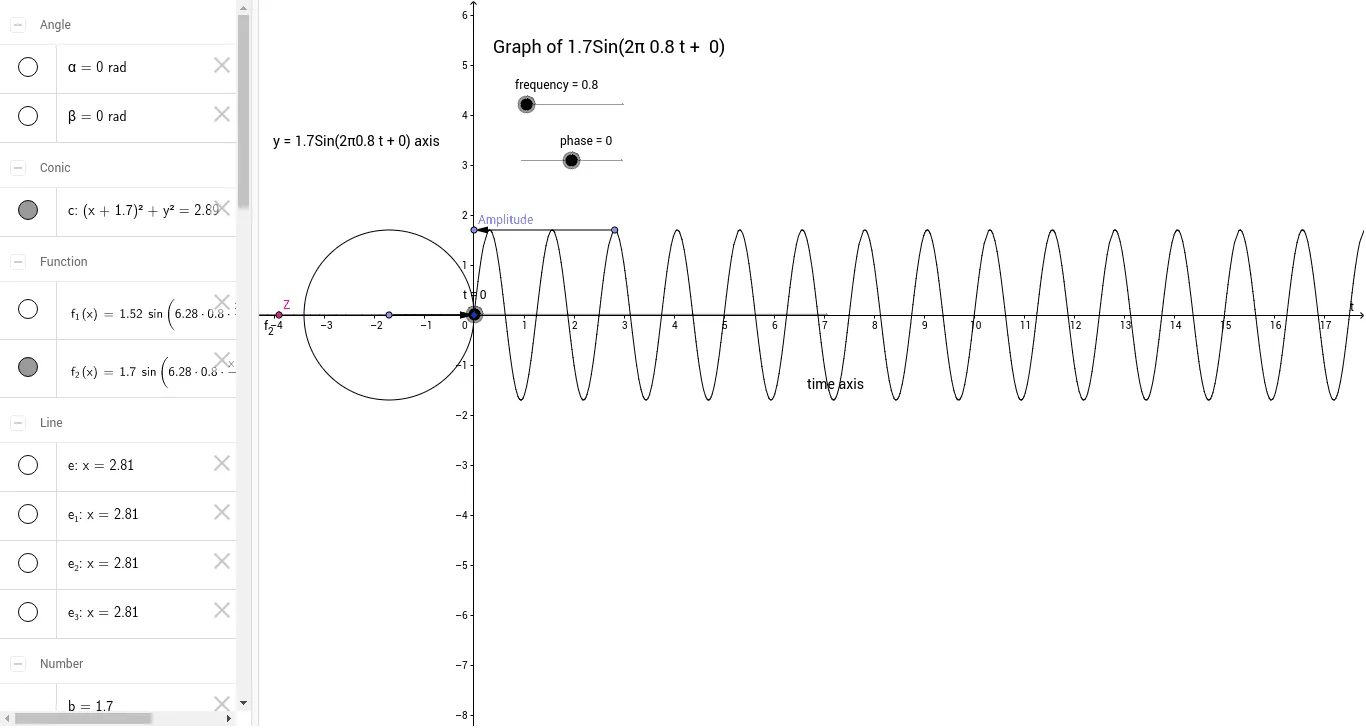
This example demonstrates the sine wave, an important concept in trigonometry. By adjusting parameters like frequency and phase, you can observe changes in the waveform. The construction uses commands like Point, Segment, Circle, Vector, Rotate, and Angle in GeoGebra, suitable for high school math education or learning.
GeoGebra Commands & Parameters
Point(e) → ISegment(F, D) → aCircle((-y(I), 0), y(I)) → cVector(I, Amplitude) → uVector(B, F) → vPoint(c) → CRotate(C, 6.28 * frequency * t + phase, B) → C'_1Point(e_2) → I_1Vector(B, F_1) → wRotate(F, -phase, B) → F'Angle(F', B, F) → αAngle(F, B, F') → β
AI Drawing Prompt Reference
Draw a sine wave demonstration: place a horizontal segment, use one endpoint as the center of a circle whose radius equals the vertical distance from the other endpoint to the axis; pick a point on the circle and rotate it according to adjustable frequency and phase parameters, projecting its vertical coordinate to trace the sine curve; also show an amplitude vector, a phase vector, and two angles indicating the phase difference.
The prompt above was compiled from the original drawing commands and is for reference only.