
Sine Wave Phasor Diagram
Loading the math board and drawing, please wait…
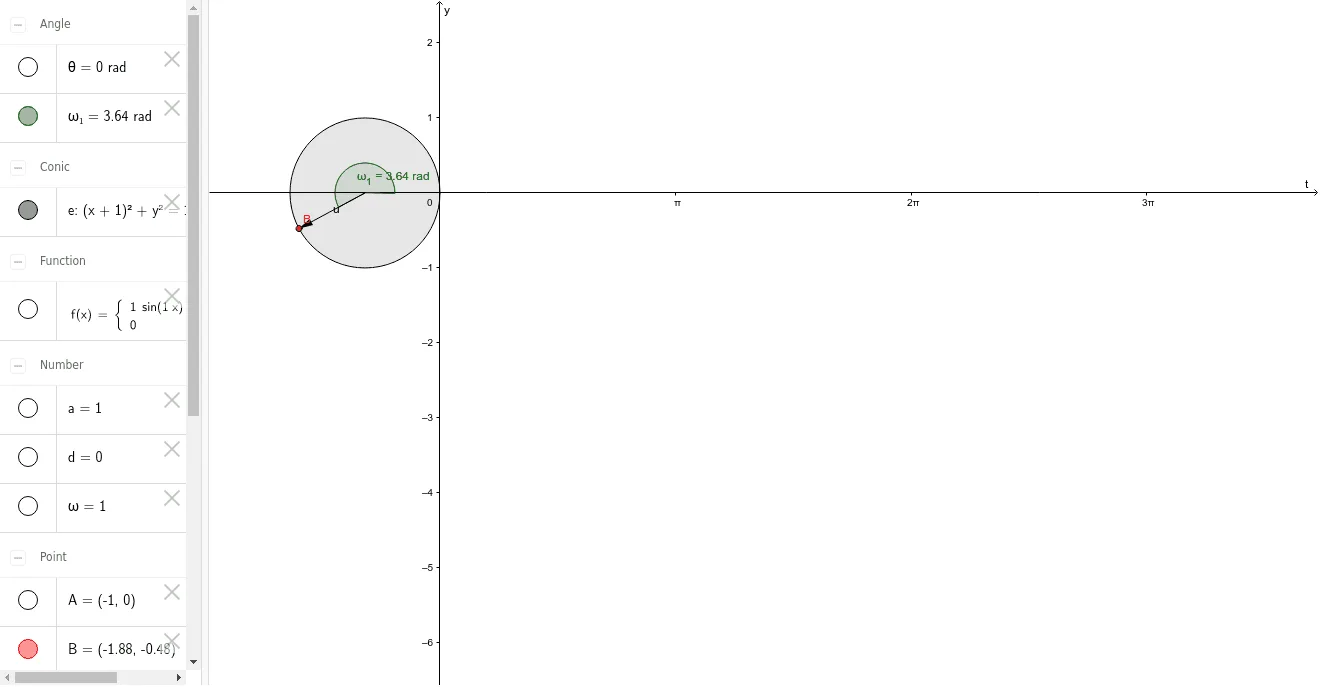
This example demonstrates a sine wave phasor diagram, involving concepts of trigonometry and complex numbers. By creating phasors and rotating points, the phase relationship of the sine wave can be intuitively understood. The construction summary mentions the use of commands: TextField, Point, Circle, Vector, Angle. Suitable for high school mathematics education and learning.
GeoGebra Commands & Parameters
Textfield(a) → inputBox1Textfield(θ) → inputBox2Textfield(ω) → inputBox3Point(xAxis) → ACircle(A, 1) → ePoint(e) → BVector(A, B) → uAngle(O, A, B) → ω_1
AI Drawing Prompt Reference
Draw a sine wave phasor diagram by first taking a point A on the x-axis, then drawing a unit circle e with A as the center, and taking another point B on circle e. Draw vector u from A to B, and finally draw angle OAB with its size determined by the input box angle ω.
The prompt above was compiled from the original drawing commands and is for reference only.