
Sine Wave Investigation
Loading the math board and drawing, please wait…
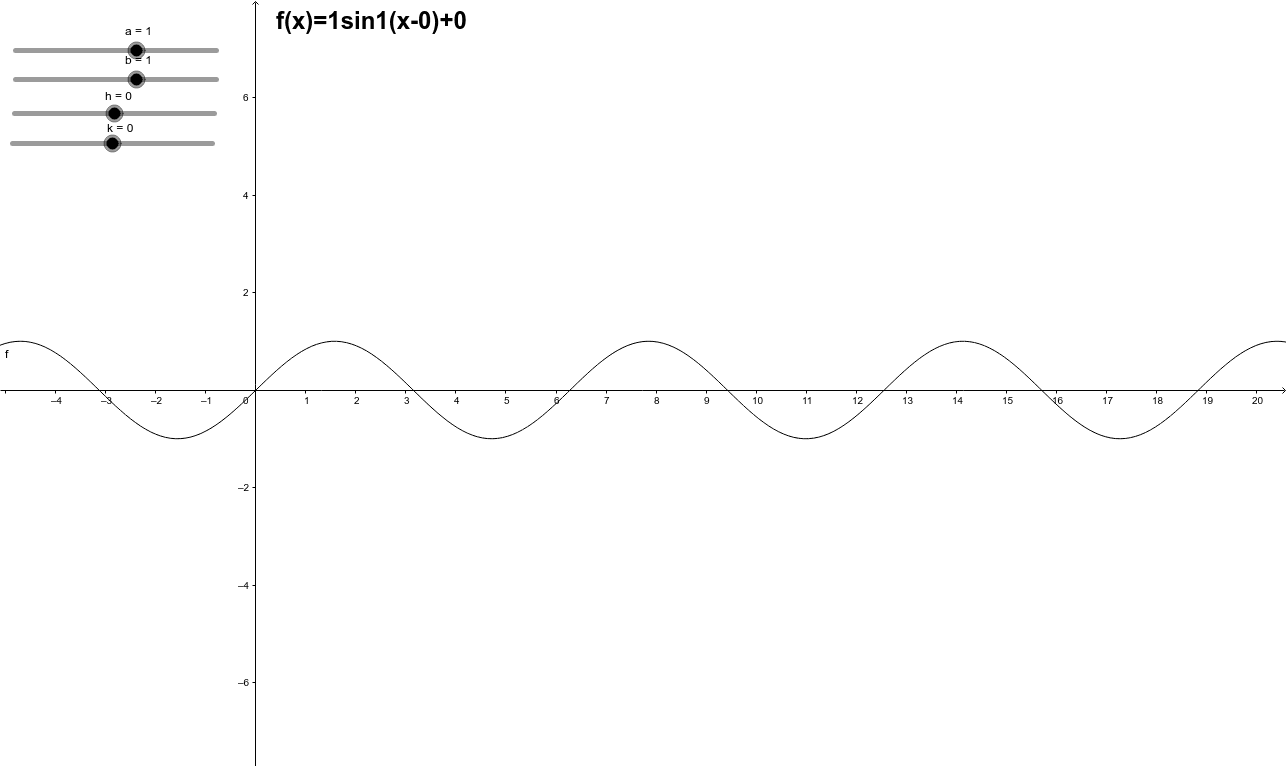
This example demonstrates the process of graphing a sine wave, involving core math concepts like trigonometric functions, coordinate systems, and parameter variations. It uses GeoGebra commands/objects: a (amplitude), b (frequency), h (horizontal shift), k (vertical shift), f (function), text1 (text). Suitable for high school students to understand the basic properties of sine wave graphs and the impact of parameters on the graph.
GeoGebra Commands & Parameters
Numeric a(1.0)Numeric b(1.0)Numeric h(0.0)Numeric k(0.0)f(x) = (a * sin((b * (x - h)))) + k
AI Drawing Prompt Reference
Draw a sine wave with amplitude 1, frequency 1, horizontal shift 0, and vertical shift 0. First, set the amplitude a to 1, the frequency b to 1, the horizontal shift h to 0, and the vertical shift k to 0. Then, plot the function f(x) = a * sin(b * (x - h)) + k based on these parameters.
The prompt above was compiled from the original drawing commands and is for reference only.