
Sine Transformation Demo
Loading the math board and drawing, please wait…
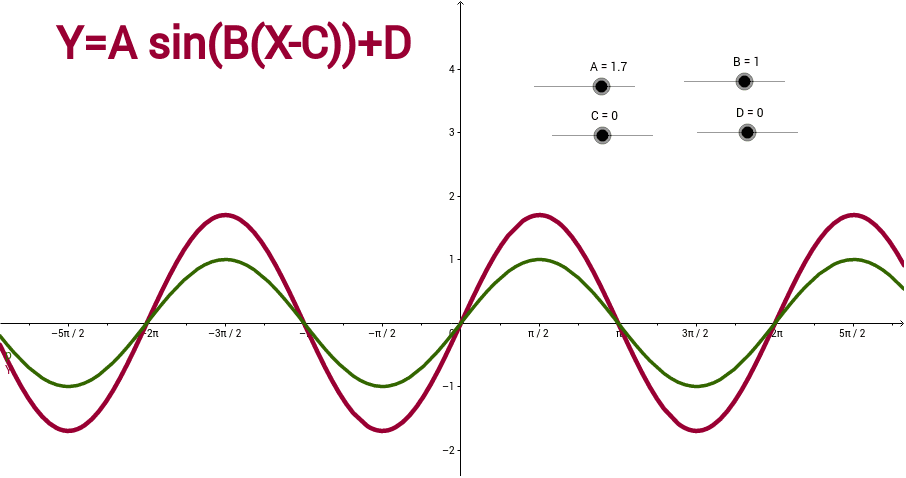
This example demonstrates how the graph of a sine function changes as its parameters are varied via sliders. It covers core concepts such as trigonometric functions, function graphs, transformations, the unit circle, and reflections. Construction uses GeoGebra objects A, B, C, D, Y, text2, p together with slider controls to define and update the sine curve in real time. Suitable for high‑school trigonometry lessons, college‑prep review, and interactive classroom presentations.
GeoGebra Commands & Parameters
Numeric A(1.7)Numeric B(1.0)Numeric C(0.0)Numeric D(0.0)Y(x) = A * sin(B * (x - C)) + Dp(x) = sin(x)