
Sine Function Graph Exploration
Loading the math board and drawing, please wait…
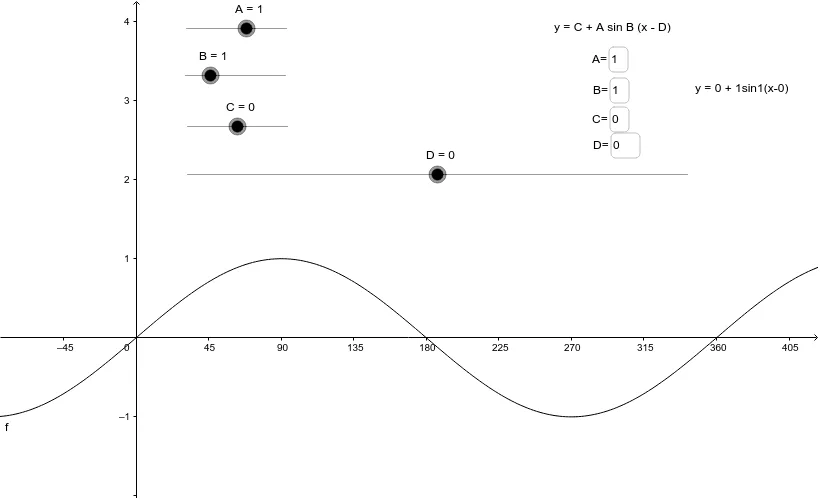
This example demonstrates the translations and dilations of the sine function graph. It involves core math concepts like the properties of the sine function, horizontal and vertical translations, and horizontal and vertical dilations of function graphs. The construction uses GeoGebra commands such as Textfield for objects C, A, B, D, text1, text2, defines the function object f, and employs four input boxes (inputBox1, inputBox2, inputBox3, inputBox4) for interactive parameter adjustments. It is suitable for high school students learning trigonometric functions and function graph transformations, or for mathematical teaching demonstrations.
GeoGebra Commands & Parameters
Textfield(C) → inputBox1Textfield(A) → inputBox2Textfield(B) → inputBox3Textfield(D) → inputBox4
AI Drawing Prompt Reference
Draw a sine function graph and show its translations and dilations. Include four interactive input boxes to adjust the parameters for horizontal left translation, vertical up translation, horizontal dilation, and vertical dilation, observing the changes in the sine function graph through these adjustments.
The prompt above was compiled from the original drawing commands and is for reference only.