
Sine Function Demonstration - Grade 11
Loading the math board and drawing, please wait…
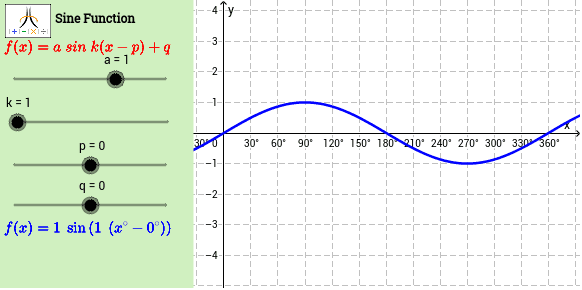
This example demonstrates the graph of the sine function and its variation patterns. It involves core mathematical concepts including trigonometric functions, limits in differential calculus, upper and lower sums or Riemann sums, and binomial distribution. The construction uses GeoGebra commands Corner and Polygon, with objects such as a, k, p, q, f, text1, text2, text3, P, Cnr1, Cnr2, Cnr3, Cnr4, CN1, CN2, CN4, CN3, Panel, cn1, cn2, cn3, cn4, Frame, cnr1, cnr2, cnr3, cnr4, pic1. It is suitable for Grade 11 students learning about the sine function and related calculus concepts.
GeoGebra Commands & Parameters
Corner(1, 1) → Cnr1Corner(1, 2) → Cnr2Corner(1, 3) → Cnr3Corner(1, 4) → Cnr4Polygon(CN1, CN2, CN3, CN4) → Panel, cn1, cn2, cn3, cn4Polygon(Cnr1, Cnr2, Cnr3, Cnr4) → Frame, cnr1, cnr2, cnr3, cnr4
AI Drawing Prompt Reference
Draw the graph of a sine function to demonstrate its variation patterns, incorporating core mathematical concepts like trigonometric functions, differential limits, upper and lower sums or Riemann sums, and binomial distribution. Start by plotting four corner points, then connect them to form a polygon. Next, construct another polygon using these corner points, and finally combine the two polygons to show the geometric construction of the sine function.
The prompt above was compiled from the original drawing commands and is for reference only.