
Sine Function Animation
Loading the math board and drawing, please wait…
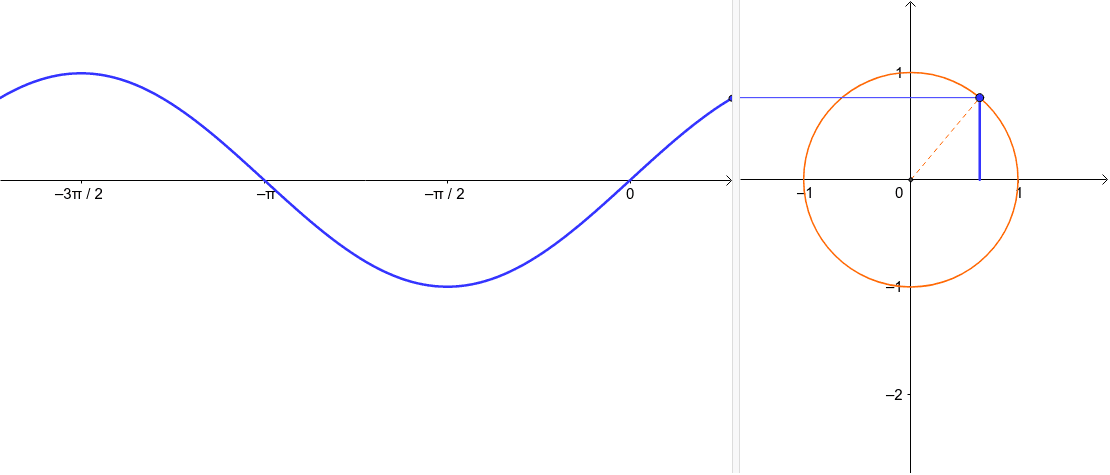
This example demonstrates the animation of a sine function. It involves the core concept of trigonometric functions, showing the changes in the sine function graph through a slider animation. The construction uses GeoGebra objects such as intersection, circle, and ray.
GeoGebra Commands & Parameters
Intersect(xAxis, yAxis) → CCircle(C, A) → cRay(A, (-2, y(A))) → aSegment(C, A) → bRay(C, A) → dIntersect(c, d) → D,Segment(D, (x(D), 0)) → e
AI Drawing Prompt Reference
Draw an animation of a sine function to show the changes in the sine function graph. Start by plotting the intersection of the coordinate axes, then draw a circle centered at this point. Next, draw a ray from the center, and connect the center to the ray's starting point to form a segment. Then, draw another ray from the center in the opposite direction. Finally, find the intersection of the circle and this ray, and connect the intersection point to the x-axis. Use a slider to control the parameter and observe the dynamic changes in the sine function graph.
The prompt above was compiled from the original drawing commands and is for reference only.