
Sine & Cosine Graphs with Sliders: Dynamic Exploration
Loading the math board and drawing, please wait…
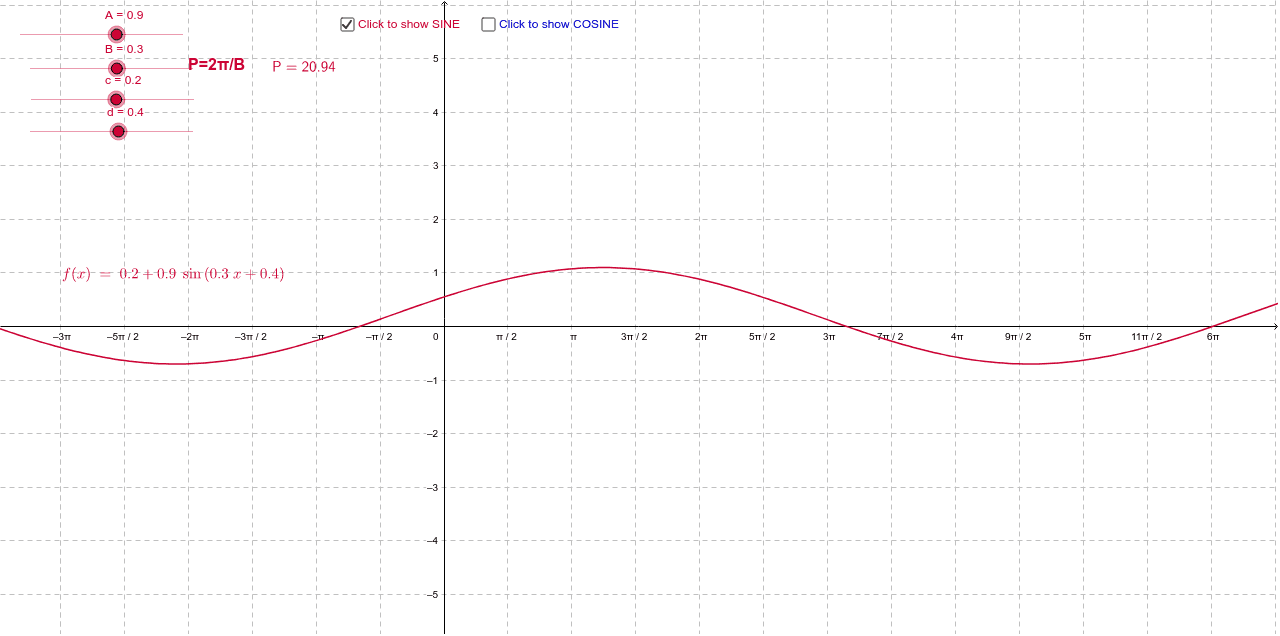
This example demonstrates the dynamic behavior of sine and cosine functions using sliders in GeoGebra. It helps students understand key concepts such as periodicity, amplitude, and phase shifts. The construction involves objects like A, B, c, d, f, g and text labels text7, text8. This is suitable for middle or high school mathematics education to explore function graphs and dynamic visualization.
GeoGebra Commands & Parameters
Numeric A(0.9)Numeric B(0.3)Numeric c(0.2)Numeric d(0.4)Numeric A'(0.8)Numeric B'(1.6)Numeric c'(0)Numeric d'(-1.2)f(x) = c + (A * sin((B * x) + d))g(x) = c' + (A' * cos((B' * x) + d'))Boolean a(true)Boolean b(false)
AI Drawing Prompt Reference
Draw a dynamic graph of sine and cosine functions. The sine function and cosine function should be adjustable via sliders for amplitude, period, and phase shift. The graph should show the trends of these functions and label key points. Ensure the graph is clear to help understand the periodicity and phase changes of trigonometric functions.
The prompt above was compiled from the original drawing commands and is for reference only.