
Sine and Cosine
Loading the math board and drawing, please wait…
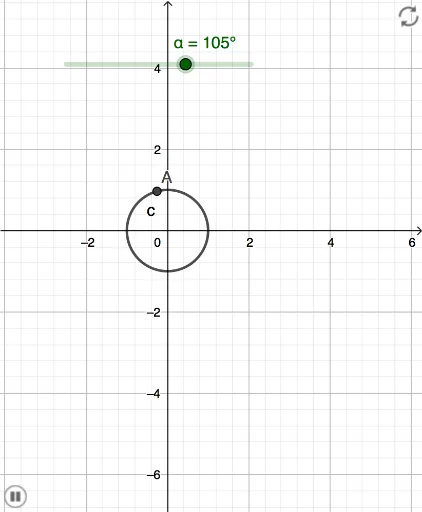
This example demonstrates the graphs of sine and cosine functions. It involves core concepts of trigonometry, showing the properties of sine and cosine functions through the use of Intersect and Rotate commands. Suitable for high school mathematics education and learning.
GeoGebra Commands & Parameters
Intersect(c, xAxis, 2) → CIntersect(xAxis, yAxis) → BRotate(C, α, B) → A
AI Drawing Prompt Reference
Draw the graphs of sine and cosine functions, showing their intersections and rotational relationships in the coordinate system, first find the intersection points of the sine curve with the x-axis, then find the intersection point of the x-axis and y-axis, and finally rotate the intersection point of the sine curve around the intersection point of the x-axis and y-axis to show the periodicity and symmetry of the functions.
The prompt above was compiled from the original drawing commands and is for reference only.