
Sine and Cosine Translation Demonstration
Loading the math board and drawing, please wait…
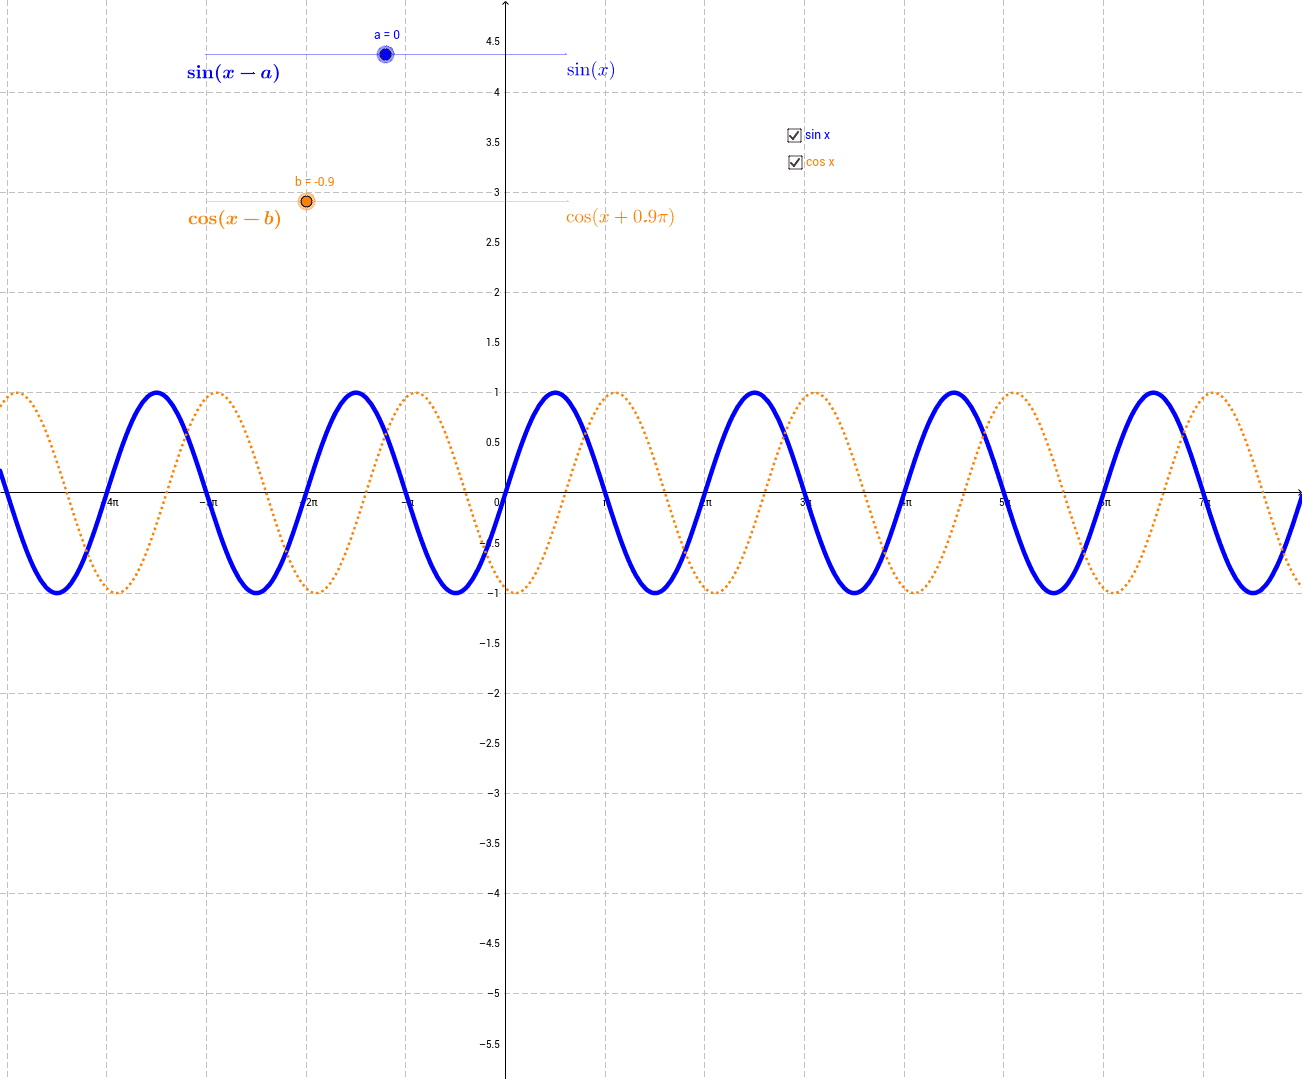
①This example dynamically illustrates the horizontal and vertical translations of the sine function y=sin(x) and cosine function y=cos(x) on a coordinate plane, showing how shifting parameters alter the graphs. ②Core mathematical concepts include phase shift (horizontal translation), vertical displacement, parametric curves, and the projection of points on the unit circle onto the sine/cosine axes, with additional connections to variance and correlation as statistical visualizations. ③Construction details: The GeoGebra objects include parameters a, b, c, d, e, functions f and g for sine and cosine, text labels (sinText_1, sinLabel, cosLabel, cosText_1, sinText, sinText_2, cosText, cosText_2) for annotations, and likely a circumcircle to relate angles to function values. Sliders or draggable points control the translation amounts. ④This resource is suitable for high school or early college students learning trigonometric transformations, and for teachers demonstrating phase shifts and vertical shifts in classroom settings, helping learners grasp the geometric meaning of parameter changes.
GeoGebra Commands & Parameters
Numeric a(0.0)Numeric b(-0.9)a - bf(x) = sin(x - (a * π))g(x) = cos(x - (b * π))Boolean d(true)Boolean e(true)