
Sine and Cosine Phase Shifted
Loading the math board and drawing, please wait…
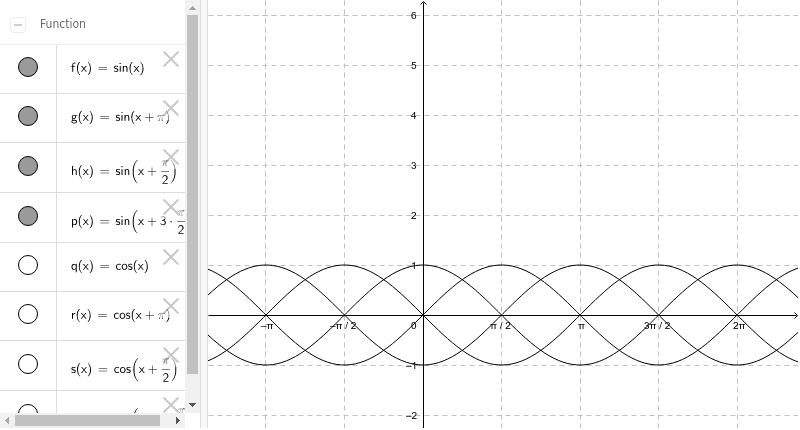
This example demonstrates the phase shift of sine and cosine functions by π/2. It involves the core concept of trigonometric functions, showing the relationship between sine and cosine functions through a phase shift. The construction uses GeoGebra commands such as functions, suitable for high school mathematics education and learning.
GeoGebra Commands & Parameters
f(x) = sin(x)g(x) = sin(x + π)h(x) = sin(x + π / 2)p(x) = sin(x + 3 * π / 2)q(x) = cos(x)r(x) = cos(x + π)s(x) = cos(x + π / 2)t(x) = cos(x + 3 * π / 2)
AI Drawing Prompt Reference
Draw the graphs of sine and cosine functions to demonstrate their phase shift relationship. Start by drawing the sine function f(x) = sin(x), then draw the sine function with a phase shift of π, g(x) = sin(x + π). Next, draw the sine function with a phase shift of π/2, h(x) = sin(x + π / 2). Finally, draw the sine function with a phase shift of 3π/2, p(x) = sin(x + 3 * π / 2). Then, draw the cosine function q(x) = cos(x), followed by the cosine function with a phase shift of π, r(x) = cos(x + π). Next, draw the cosine function with a phase shift of π/2, s(x) = cos(x + π / 2). Finally, draw the cosine function with a phase shift of 3π/2, t(x) = cos(x + 3 * π / 2).
The prompt above was compiled from the original drawing commands and is for reference only.