
Sine and Cosine Graphing
Loading the math board and drawing, please wait…
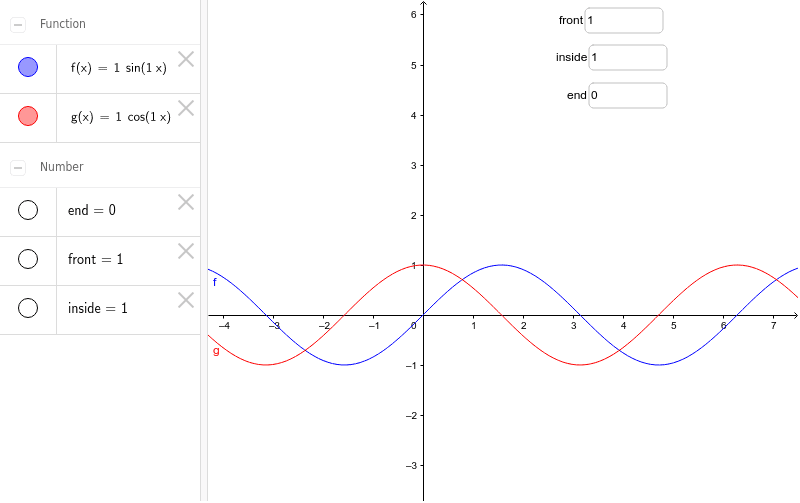
This applet demonstrates how the graphs of sine and cosine functions change, helping students understand the basic properties of trigonometric functions. By adjusting parameters, students can observe changes in the frequency and phase of the function graphs. The construction summary mentions the use of Textfield, front, inside, end, inputBox1, inputBox2, inputBox3, f, and g objects and commands. Suitable for high school mathematics education and learning.
GeoGebra Commands & Parameters
Textfield(front) → inputBox1Textfield(inside) → inputBox2Textfield(end) → inputBox3
AI Drawing Prompt Reference
Draw the graphs of sine and cosine functions, and observe how they change by adjusting parameters. Use three text input boxes to input parameters for the sine and cosine functions, and observe the changes in the graphs. First input parameters for the sine function, then for the cosine function, and finally adjust the parameters to see the changes in the graphs.
The prompt above was compiled from the original drawing commands and is for reference only.