
Simulating Multi-step Experiments with Step Functions
Loading the math board and drawing, please wait…
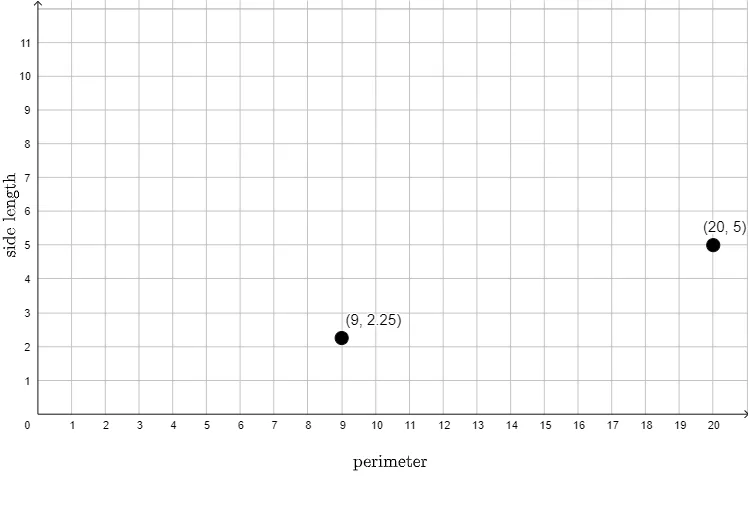
This example demonstrates how to simulate a multi-step experimental process in GeoGebra by mapping each stage of the experiment to a visible, step-like (piecewise) change. It highlights key ideas such as step functions for representing discrete phases, iterative or sequence-style updates of states, and clear graphical presentation for comparing outcomes across steps. From the provided construction summary, the diagram is built around objects A and B as the core quantities/states, with two text elements (text1, text2) used to label what each step represents. The result is a classroom-friendly interactive visualization that turns a sequence of experimental updates into an interpretable geometric/graphical story. Suitable for middle and high school learners and for teaching discrete functions and graph interpretation (step functions) in an experiment-simulation context.
GeoGebra Commands & Parameters
(9, 2.25)(20, 5)
AI Drawing Prompt Reference
Draw a graph with two steps, each representing a numerical change. The first step goes from 9 to 20, and the second step goes from 20 to 5. The graph should show two consecutive rectangles or bars with different colors to distinguish the steps. Text labels should indicate the start and end values of each step. The construction order is to draw the first step, then the second step, and finally add the text labels.
The prompt above was compiled from the original drawing commands and is for reference only.