
Simplifying Fractions Interactive: Pie Chart & Set Visualization
Loading the math board and drawing, please wait…
In collections
Fractions الكسور
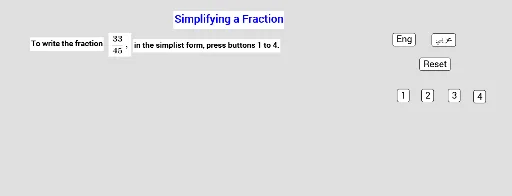
This GeoGebra example demonstrates fraction simplification using pie charts (circle charts) and set-theory visualizations, making the process of reducing fractions intuitive. Core math concepts include equivalent fractions, greatest common divisor (GCD), and the fundamental property of fractions. Construction highlights: Random command generates random numerators/denominators, Intersection finds common divisors, Element extracts values; buttons (button1-7) drive interactive steps, text objects (text1-33) display fractions and explanations, Sh1-Sh4 visualize partitioned sections, with bilingual support for Arabic (Arab) and English (Eng). Suitable for upper elementary to middle school students learning fraction operations, and useful for classroom demonstrations or self-paced exploration of simplification rules.
GeoGebra Commands & Parameters
Random(1, 50) → aIntersection(DivisorsList[a], DivisorsList[b]) → CDElement(Last[CD], 1) → d
AI Drawing Prompt Reference
Create an interactive fraction simplification demonstration with pie charts and set theory visualizations. Generate two random fractions and display them as pie charts, showing the simplification process using set theory. The pie charts should be divided into sections based on the common divisors of the fractions. Include interactive buttons to control the steps, text elements to show fractions and explanations, and support both Arabic and English languages.
The prompt above was compiled from the original drawing commands and is for reference only.