
Histogram and Binomial Distribution
Loading the math board and drawing, please wait…
In collections
Conics
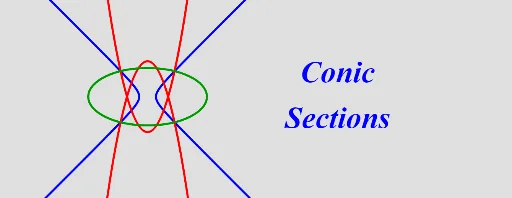
This example demonstrates how to use GeoGebra to create histograms and visualize the properties of the binomial distribution. Key mathematical concepts include histograms, binomial distribution, exponential functions, sequences and series, and median lines. The construction utilizes GeoGebra commands/objects such as Intersect, Conic, and objects like c, d, e, A, B, C, D, E, F, G, H, I, f, text0_1. It is suitable for high school and above students to understand binomial distribution and its graphical representation, as well as to learn data analysis and visualization using geometric tools.
GeoGebra Commands & Parameters
Intersect(c, e) → A, B, C, DIntersect(d, c) → E, F, G, HConic(B, C, F, G, I) → f
AI Drawing Prompt Reference
Create a histogram to visualize the binomial distribution, highlighting key mathematical concepts like histograms, binomial distribution, exponential functions, sequences, series, and median lines. Begin by finding the intersection points of two curves to get four key points, then find the intersection points of two other curves to get four more points, and finally construct a conic using these eight points to complete the graph.
The prompt above was compiled from the original drawing commands and is for reference only.