
Simplex Algorithm Demonstration
Loading the math board and drawing, please wait…
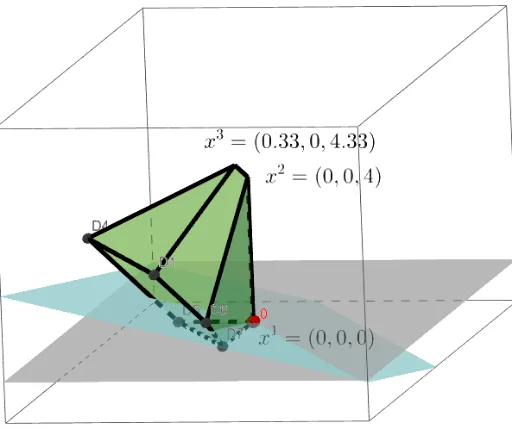
This example dynamically demonstrates the Simplex algorithm for linear programming, visually showing vertex iteration and the search for the optimal solution. It involves core mathematical concepts like linear inequalities, feasible regions, objective functions, and simplex tables. The construction uses commands such as Segment and Polygon, along with objects like vertices, buttons, and polygons, to visualize the algorithm's steps. Suitable for high school and above students learning linear programming, optimization theory, and algorithm visualization.
GeoGebra Commands & Parameters
Segment(D2, D5) → fSegment(D5, D4) → gSegment(D5, D7) → hSegment(D7, D6) → iSegment(D7, D2) → jSegment(D6, D1) → kSegment(D1, D4) → lSegment(D6, D8) → nSegment(D2, D8) → pSegment(D1, D3) → qSegment(D3, D8) → sSegment(D4, D3) → tPolygon(D7, D2, D5) → t1, d5, d7, d2Polygon(D4, D3, D8, D2, D5) → poly1, d4, d3, d8, m, rPolygon(D2, D7, D6, D8) → q1, a, b, d6, c
AI Drawing Prompt Reference
Draw a geometric figure composed of multiple line segments and pentagons to demonstrate the Simplex algorithm for linear programming. Include one pentagon and two larger pentagons that together form a closed region representing the feasible region. Connect the vertices of these polygons with line segments to create a network structure, some of which indicate the objective function and constraints. The figure should dynamically show the vertex iteration process and the search path for the optimal solution.
The prompt above was compiled from the original drawing commands and is for reference only.