
Simplest Form
Loading the math board and drawing, please wait…
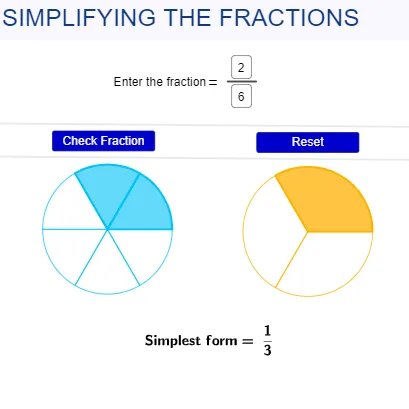
This example demonstrates the concept of simplest form. Core mathematical concepts include fractions, logarithmic functions, quadratic equations, division, and orthocenter. Using GeoGebra commands such as Textfield, Circle, Sequence, Line, Segment, If, etc., relevant geometric figures can be constructed. Suitable for students from junior high school and above.
GeoGebra Commands & Parameters
Textfield(num) → InputBox1Textfield(den) → InputBox2Circle(D, r) → hSequence(CircleSector[D, (x(D) + (r * cos((α_{1} * (i - 1)))), y(D) + (r * sin((α_{1} * (i - 1))))), (x(D) + (r * cos((α_{1} * i))), y(D) + (r * sin((α_{1} * i))))], i, 1, n) → e1Sequence(CircleSector[C, (x(C) + (r * cos((α * (i - 1)))), y(C) + (r * sin((α * (i - 1))))), (x(C) + (r * cos((α * i))), y(C) + (r * sin((α * i))))], i, 1, num) → f1Sequence(CircleSector[D, (x(D) + (r * cos((α_{1} * (i - 1)))), y(D) + (r * sin((α_{1} * (i - 1))))), (x(D) + (r * cos((α_{1} * i))), y(D) + (r * sin((α_{1} * i))))], i, 1, d) → equiSequence(CircleSector[C, (x(C) + (r * cos((α * (i - 1)))), y(C) + (r * sin((α * (i - 1))))), (x(C) + (r * cos((α * i))), y(C) + (r * sin((α * i))))], i, 1, den) → fracLine(A_1, B_1) → tLine(C_1, t) → f_1Segment(H, I) → fCircle(C, r) → gIf(num ≠ 0 ∧ den ≠ 0 ∧ num ≤ den, true, false) → a
AI Drawing Prompt Reference
Create a diagram illustrating the concept of simplest form, incorporating fractions, logarithmic functions, quadratic equations, and orthocenters. Draw a circle with two concentric circle sectors to represent the numerator and denominator. Then, create sequences of colored circle sectors to depict the breakdown of the fraction. Connect the center of the circle to the vertices of the sectors with line segments to form geometric patterns. If the numerator is less than or equal to the denominator, draw a line from the center and mark the orthocenter to highlight geometric relationships.
The prompt above was compiled from the original drawing commands and is for reference only.