
Shreddies and Milk 1
Loading the math board and drawing, please wait…
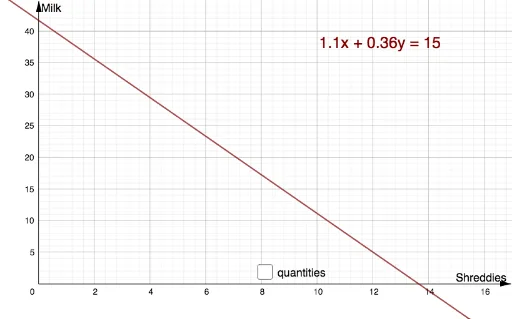
This example demonstrates the integration of linear functions, quadratic functions, inequalities, rotation, translation, histograms, and parabolas. It involves core mathematical concepts such as solving inequalities, graphing linear and quadratic functions, geometric transformations (rotation and translation), and statistical data representation. The construction uses GeoGebra commands like Point, eq1, A, shreddies, milk, text1, text2, a, and text3. It is suitable for high school mathematics education, showcasing the combination of function transformations, geometric constructions, and data analysis.
GeoGebra Commands & Parameters
Point(eq1) → A
AI Drawing Prompt Reference
Draw a graph incorporating linear and quadratic functions, showing the solution set of inequalities, while including rotational and translational geometric transformations, as well as histograms and parabolas, demonstrating the integration of function transformations, geometric constructions, and data analysis. Start by defining and plotting the linear and quadratic functions, then solve and display the inequality solution set, followed by applying rotational and translational transformations to the graph, and finally add histograms and parabolas to complete the educational example.
The prompt above was compiled from the original drawing commands and is for reference only.