
Shifts of Exponential Functions
Loading the math board and drawing, please wait…
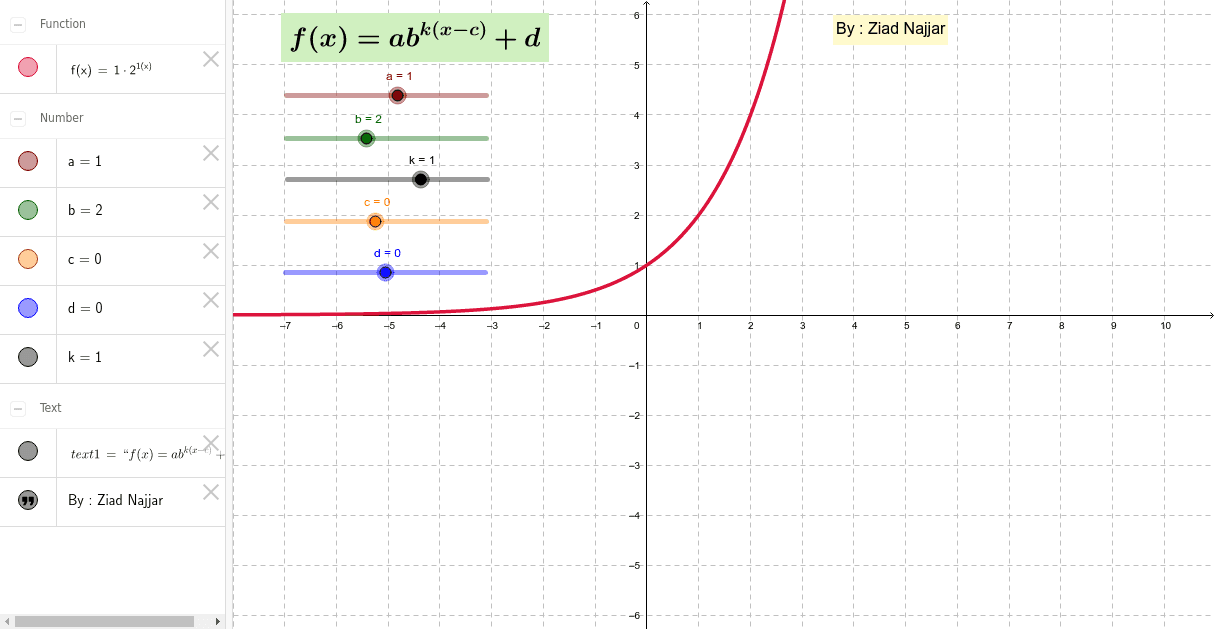
This example demonstrates how shifting the parameters of an exponential function changes its graph. Key mathematical concepts include exponential function properties, function translation, and parameter effects on graphs. Construction involves using GeoGebra objects like a, b, c, d, text1, text2, k, and f to adjust parameters and visualize shifts. Suitable for middle or high school mathematics education to help students understand function transformations and graph analysis.
GeoGebra Commands & Parameters
Numeric a(1.0)Numeric b(2.0)Numeric c(0.0)Numeric d(0.0)Numeric k(1.0)f(x) = (a * b^((k * (x - c)))) + d
AI Drawing Prompt Reference
Draw an exponential function graph. The graph depends on parameters a, b, c, d, and k. Key objects include the function graph, parameter labels, and text explanations. The construction order is to set parameters first, then draw the function graph, and finally add text explanations to explain parameter effects.
The prompt above was compiled from the original drawing commands and is for reference only.