
Shifting and Scaling Exponential Functions by joebridges
Loading the math board and drawing, please wait…
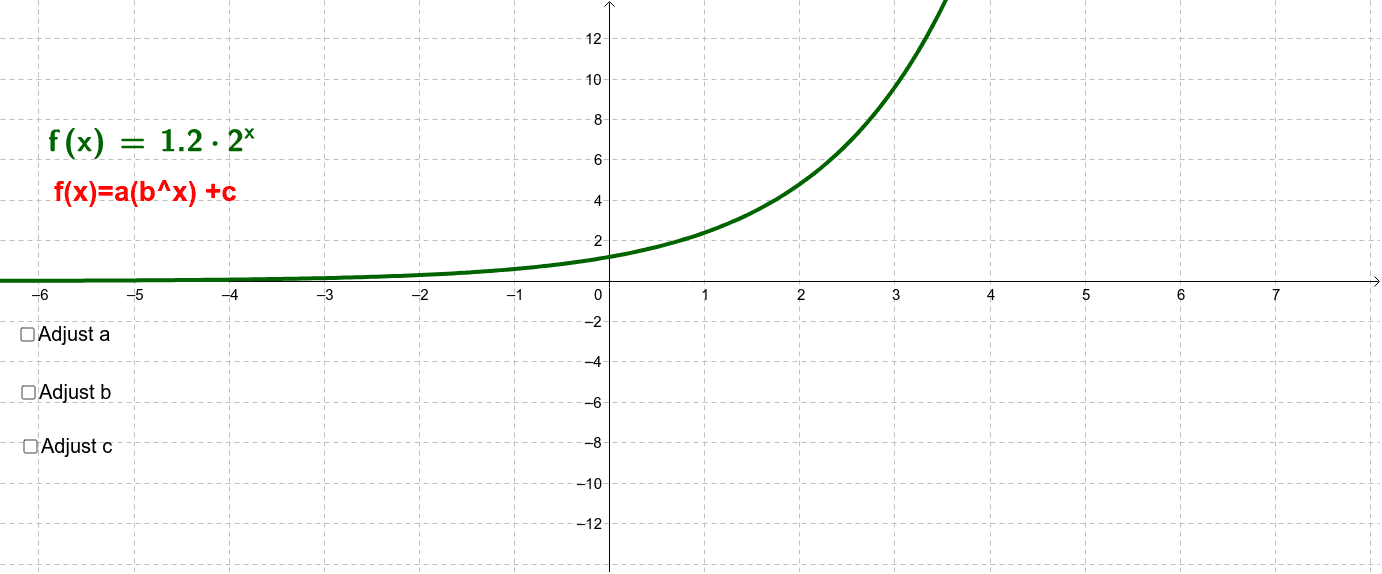
This example demonstrates how changes in the parameters of an exponential function affect its graph. It shows the basic properties of exponential functions, including how shifting and scaling the function impacts its shape. The construction uses GeoGebra commands such as sliders to adjust parameters a and b, allowing for a visual understanding of the function's behavior. Suitable for high school mathematics education and learning.
GeoGebra Commands & Parameters
LaTeX(f, true, true) → text1
AI Drawing Prompt Reference
Draw an exponential function graph and observe how it changes by adjusting parameters a and b. First, create two sliders a and b, then define the function f(x) = a * e^(b*x) using them. Change the slider values to see the graph transformation and understand the effects of shifting and scaling on the exponential function.
The prompt above was compiled from the original drawing commands and is for reference only.