
Set Union and Intersection Visual Quiz
Loading the math board and drawing, please wait…
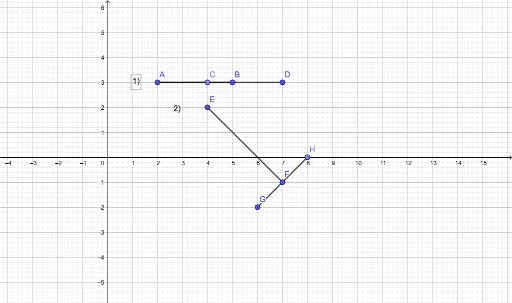
This example demonstrates how to visualize and understand set operations (union and intersection) through geometric figures (segments, points) and function graphs. The core mathematical concepts include set theory operations - Union and Intersection - along with their geometric representations. Construction details: Using the Point command to create control points (A-H), Segment command to draw line segments for geometric constructions, and function graphs (f, g, h, i, j) to show different set regions for union and intersection operations, with text objects (text1, text2) displaying quiz questions. Suitable for middle to high school mathematics learners, useful for teaching set concepts, comprehensive geometry and function exercises, or as an interactive classroom quiz tool to help students intuitively understand union and intersection operations and their geometric meanings.
GeoGebra Commands & Parameters
Segment(A, B) → fPoint(f) → CSegment(C, D) → gSegment(A, C) → hSegment(E, F) → iPoint(xAxis) → HSegment(G, H) → j
AI Drawing Prompt Reference
Draw a geometric illustration for set union and intersection: place eight control points arbitrarily; draw a segment between two points, pick a point on that segment, connect it to a third point to form a second segment, then connect the first point to the new point for a third segment; draw a fourth segment between another pair of points; place a point on the horizontal axis and connect it to a remaining control point for a fifth segment. The resulting overlapping segments create regions that visually represent union and intersection.
The prompt above was compiled from the original drawing commands and is for reference only.