
Section 3.10: Linear Approximation
Loading the math board and drawing, please wait…
In collections
Calculus 1 Graphical Illustrations
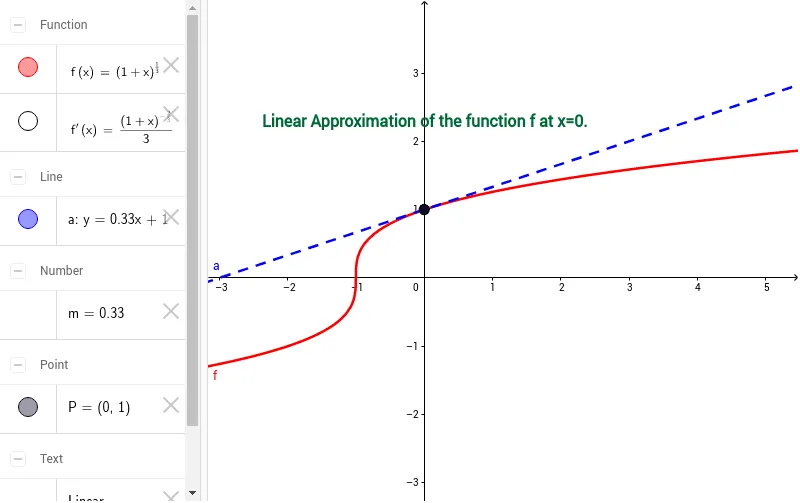
This GeoGebra example demonstrates the concept of linear approximation, also known as tangent line approximation, by showing how the tangent line at a point on a curve can be used to estimate function values near that point. The core mathematical concept is the derivative and the equation of the tangent line. The construction involves defining a function f, computing its derivative f', setting a point a, constructing the tangent line m at that point, marking the point P on the curve, and adding a text1 to display the linear approximation formula. This example is suitable for introductory calculus courses or advanced high school mathematics, helping students visualize the relationship between the derivative and local linearity, and understand how differentials are used for approximation.
GeoGebra Commands & Parameters
f(x) = (1 + x)^(1 / 3)f'(x) = f'(x)f'(0)y = 1 + (m * x)(0, f(0))
AI Drawing Prompt Reference
Draw the graph of the function f(x) = (1 + x)^(1/3) and its tangent line at x=0. Mark the point of tangency and show the linear approximation formula y = 1 + x.
The prompt above was compiled from the original drawing commands and is for reference only.