
Second Derivative Plot
Loading the math board and drawing, please wait…
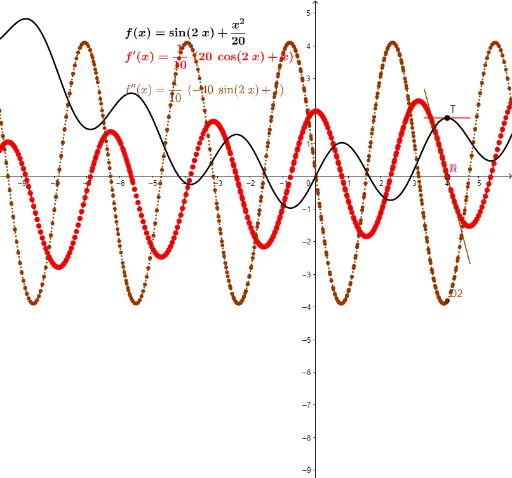
This example demonstrates how to plot the second derivative of a function. It involves core mathematical concepts such as derivatives, function graphs, and the geometric significance of second derivatives. Key GeoGebra commands/objects used include Segment, Point, If, Line, Slope, Textfield. Suitable for high school and above students studying calculus.
GeoGebra Commands & Parameters
Segment((xmn, 0), (xmx, 0)) → aPoint(a) → ASegment(T - (0.7 * (1, m)), T + (0.7 * (1, m))) → TanSegIf(togA ≟ 1, "Stop animation", "Animate A") → AnimateSegment(A, D) → ADLine(T, T + (1, m)) → TanLineSlope(TanSeg) → m_1Textfield(f) → InputfOFxTextfield(speed) → InputSpdIf(togT ≟ 0, "Show Traces", "Stop Traces") → ShowTracesSegment(D - (0.7 * (1, m2)), D + (0.7 * (1, m2))) → Tan2Seg