
Scatter Plot: Visualizing Data Distribution and Relationships
Loading the math board and drawing, please wait…
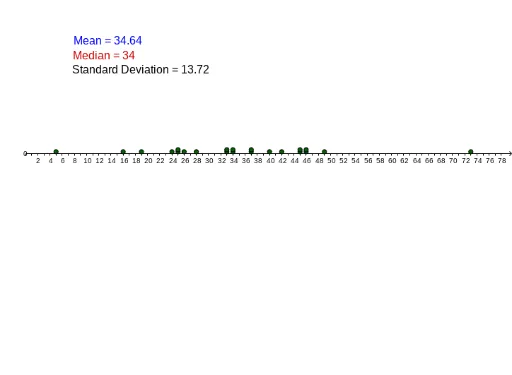
Scatter plots are used to visualize the distribution and relationships between data points, helping to understand correlations between variables. Key mathematical concepts include statistics such as mean, median, and standard deviation. Construction involves using GeoGebra commands like Median, Mean, Length, SD, and DotPlot. Suitable for middle school and above students to learn data analysis and statistical foundations.
GeoGebra Commands & Parameters
Median(A1:A20) → aMedian(A1:A20) → bMedian(A1:A20) → cMean(F1:F20) → J1Mean(H3:H3) → dLength(F1:F1) → K1Mean(A1:A50) → F1Median(A1:A50) → F2SD(A1:A50) → F3DotPlot(C1:C1) → ADotPlot(C2:C2) → MedianDotPlot(A1:A50) → list1
AI Drawing Prompt Reference
Create a scatter plot showing the distribution and relationship between data points. Include a set of data points as dots, and overlay statistical markers: a vertical line for the median, a marker for the mean, and an indication of the standard deviation to show spread. The plot should clearly display the overall trend of the data and highlight where these statistics fall relative to the points, making it easy to observe central tendency and variability. Start by plotting the raw data points, then add the median, mean, and standard deviation markers in sequence, and optionally include additional point sets for comparison.
The prompt above was compiled from the original drawing commands and is for reference only.