
Scatter Plot and Statistics Demonstration
Loading the math board and drawing, please wait…
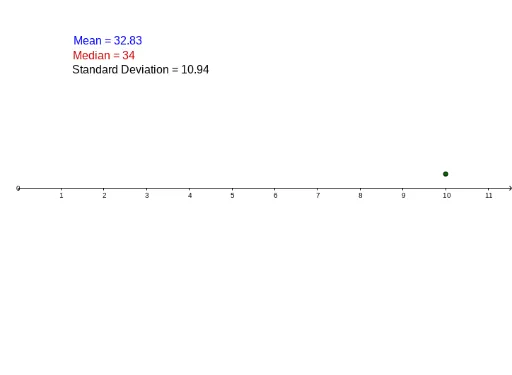
This example demonstrates how to create a scatter plot and calculate statistics using GeoGebra, involving core concepts like scatter plots, median, mean, standard deviation, and histograms. Key GeoGebra commands and objects used include Median, Mean, Length, SD, DotPlot, and various named objects like a, b, c, J1, d, K1, E1, E2, E3, F1, F2, Median_1, F3, text1, A, Median, list1, A1, A2, A3, A4, A5, A6, A7, A8, A9, A10, A11, A12, A13, A14, A15, A16, A17, A18, A19, A20, A21, A22. It is suitable for high school mathematics teaching, particularly in probability and statistics.
GeoGebra Commands & Parameters
Median(A1:A20) → aMedian(A1:A20) → bMedian(A1:A20) → cMean(F1:F20) → J1Mean(H3:H3) → dLength(F1:F1) → K1Mean(A1:A50) → F1Median(A1:A50) → F2SD(A1:A50) → F3DotPlot(C1:C1) → ADotPlot(C2:C2) → MedianDotPlot(A1:A50) → list1
AI Drawing Prompt Reference
Create a scatter plot showing the distribution of a dataset. Include multiple data points and mark the mean, median, and standard deviation. Additionally, display dot plots for the overall data, the median position, and another data subset. Add text labels indicating the computed statistical values such as mean, median, and standard deviation. The layout should be clear for teaching probability and statistics concepts.
The prompt above was compiled from the original drawing commands and is for reference only.