
Scatter Plot Graph: Coordinate Points and Vector Relations
Loading the math board and drawing, please wait…
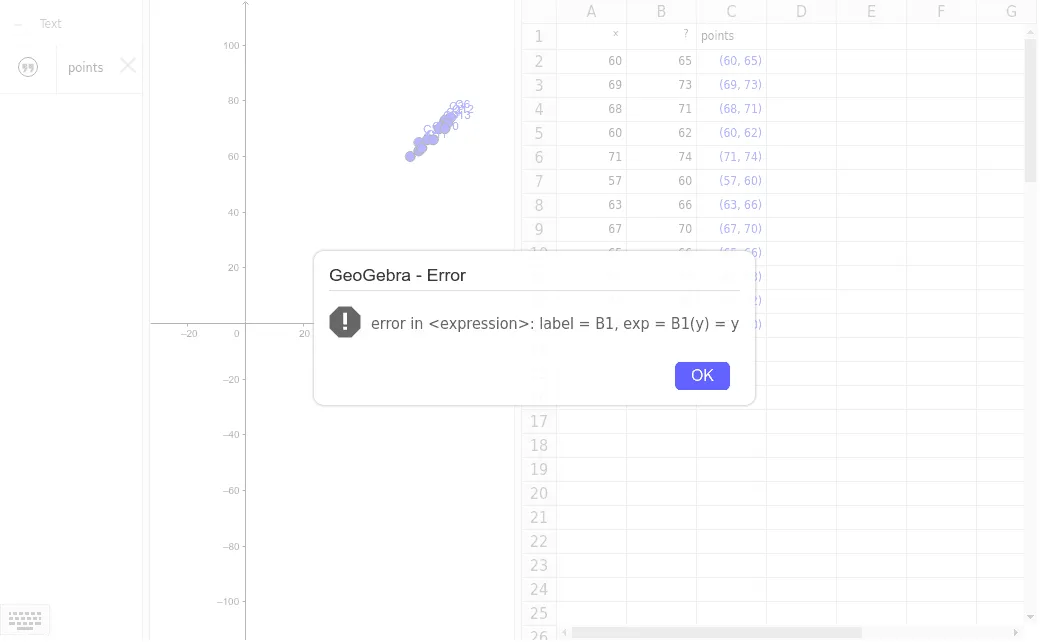
① This example demonstrates a scatter plot constructed from a set of labeled points (A1–A13, B1–B13, C1–C13) distributed on a plane, illustrating how coordinate points form a visual dataset. ② Core mathematical concepts include coordinate geometry, vectors, set theory, and the difference and slope between points, which help analyze spatial patterns and linear relationships. ③ Construction highlights: using GeoGebra point objects (e.g., A2, B2) placed at specific coordinates; the summary lists only object names, suggesting direct point creation without complex commands, possibly with vector connections or slope calculations implied. ④ Suitable for middle school or introductory statistics, teaching coordinate systems, point representation, scatter plots, and variable relationships, as well as a visual aid for set theory mappings.
GeoGebra Commands & Parameters
60696860715763676561706573716274606670666372Numeric A13(69)70B1(y) = yA1(x) = x(60, 65)(69, 73)(68, 71)(60, 62)(71, 74)(57, 60)(63, 66)(67, 70)(65, 66)(61, 63)(70, 72)(69, 70)